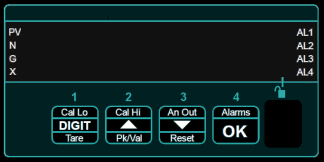
Use buttons
above to
select the
next page.


|
|
|
 | Designed, developed and built in the UK |
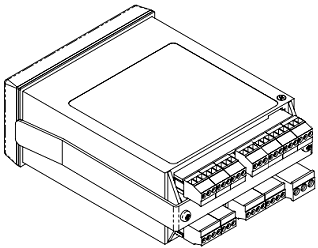
| Specifications: Plug-in Screw Terminal Connectors | |
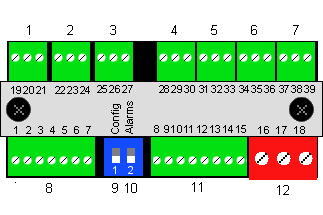
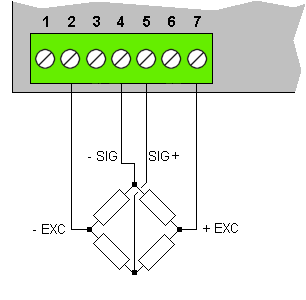
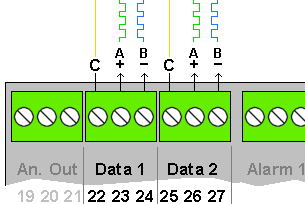
| Function | A label on the mounting bracket near each connector identifies the terminal numbers. |
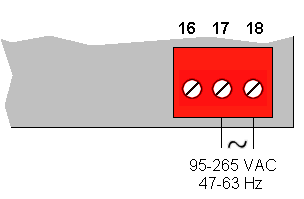
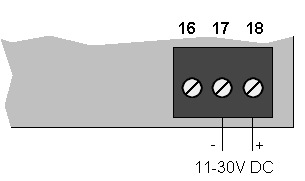
| Power | 1 x Plug-In 3 pin colour coded connector. Red : 95-265VAC power Black : 11-30V DC power Cable exits below the connector on bottom row. Use 3.2mm flat blade terminal screw driver |
| Signal/Control | Plug-In Green connector Cable exits below connector on bottom row Cable exits above the connector on top row Use 2.4mm flat blade terminal screw driver |
| Specifications: Power Supply | |
| AC Version | 95-265 V AC 47-63 Hz 8W max. Fuse with 2A 'T' rated (anti-surge) fuse. Power Connector = Red Switch-mode transformer galvanic isolation |
| DC Version | 11-30V DC 8W max. Fuse with 5A 'T' rated (anti-surge) fuse. Power Connector = Black Switch-mode transformer galvanic isolation NB: Current Limiting If your DC power has current limiting less than 2A, per meter being supplied, the voltage may fail to rise above 10V when you switch on, so the meter may not start. This is caused by the initial surge current, when the internal capacitors charge up. Ensure your power supply can provide at least 2A peak current, per meter. |
|
|
This video demonstrates how to change the colour of the display. Unlock the configuration menu first.. |
|
|
This video shows you how to change the brightness of the display. Lock the configuration menu first. |
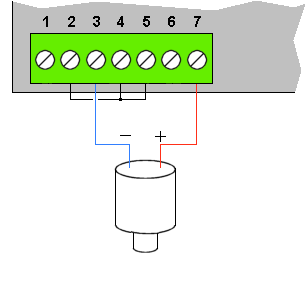
| L.cEL | Load Cell meter |
| 4-20 | 4-20mA meter |
| 10 v | 0-10V meter |
| tot | Pulse input Totaliser |
| rAtE | Pulse input RPM/Rate meter |
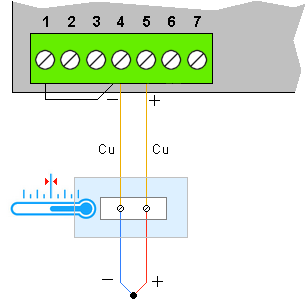
| tc b | Thermocouple type B |
| tc E | Thermocouple type E |
| tc J | Thermocouple type J |
| tc K | Thermocouple type K |
| tc n | Thermocouple type N |
| tc r | Thermocouple type R |
| tc S | Thermocouple type S |
| tc t | Thermocouple type T |
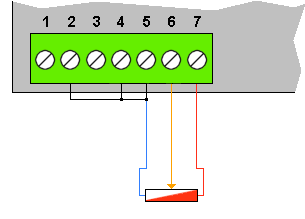
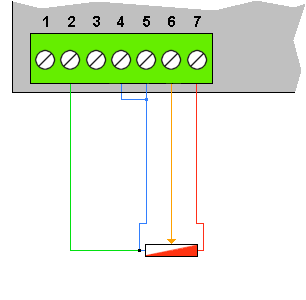
| rtd.A | PT100 / RTD |
| rtd.b | PT1000 / RTD |
| rES | Resistance meter 4 wire |
| Pot | 3 wire Potentiometer |
| Shnt | DC mV Shunt meter |
| ElAP | Elapsed Timer function |
You can install option modules in your meter, to get these extra types: | |
| 88:88 | Clock function |
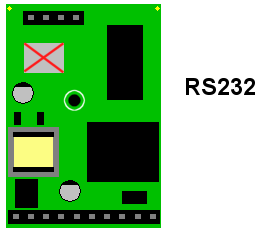
| 232 | RS232 slave input display |
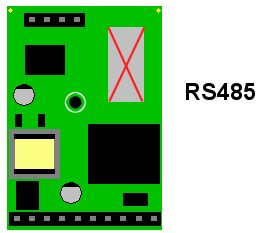
| 485 | RS485 slave input display |
| P.FrE | Power Freq. 47.000 to 63.000 Hz. |
|
| This video shows how to select from the available input types. |
How to choose a Calibration Method:Direct Calibration is recommended, because it calibrates the whole system including thedisplay and the load cells and any leverage effects. You will put a known calibration weight on the platform and adjust the meter to read that weight exactly.Theoretical Calibration is only recommended if you cannot apply a test weight to your system. You will enter details from the load cell calibration certificate. Selection Method: Unlock the calibration menu, select Ed.CF Press button 1 and button 2 at the same time, for 3 seconds. The display will briefly show C.SrC (Calibration source). It will then show either ... Direct dir. or Theoretical thEo.. Press button 2 or button 3 to choose the calibration type you want. Press OK to save your choice. |
Direct Calibration (Recommended)Choose direct calibration if you will put known calibration weights on the system to calibrate the display. We recommend this calibration mode, because it allows you to calibrate your whole weighing system in one procedure.Unlock the calibration menu, select Ed.CF Press Button 1 for three seconds. You should see dir. You may see Theo. If so, go back and select dir You will see In.Lo. Apply the lowest load value, usually 0kg To save your choice, press OK Then you will see rd.Lo. Adjust the display to its desired reading for this load. To save your choice, press OK Press Button 2 for three seconds. You will see In.Hi. Apply the highest load value, ideally 100% of full load. To save your choice, press OK You can calibrate with less load, with proportionally less accuracy. You will see rd.Hi. Adjust the display to its desired reading for this load To save your choice, press OK That completes the Direct Calibration. We suggest that you check 0% load and some intermediate loads, to ensure your system is working as you wish. This video shows how to calibrate with a known weight (direct calibration). In this example, we start with an empty load cell platform and set the display to show 0.000. We then put a known 5.000 kg weight on the load cell platform and adjust the display to show 5.000 kg. |
|
| This video demonstrates how to change the decimal point position. |
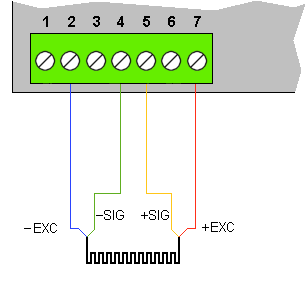
| Load Cell Model: LCC25 | |
| Certificate of Calibration | |
| Capacity: | 2500 kg |
| Sensitivity: | 2.156mV/V |
| Resistance: | 354 Ohms |
| Excitation: | 5-12V |
| Tested by: |  Wed 22nd Jul 2026 |
|
|
This video demonstrates how to calibrate without an input signal (theoretical calibration). We will use the example calibration sheet above, with 3 x load cells which are 2.156mV/V, each with 2500kg capacity (total capacity 7500 kg). Load cells are 354 Ohms, measured between the excitation terminals. The -540kg result is because we have a previous 540kg tare value already stored in the meter. |
| Excitation Power | Smart constant current (patented) cable resistance compensation. Generates a nominal 8V excitation at initial installation calibration and maintains a constant voltage across the cells as cable resistance varies. 120mA current capacity. Will warn you if your cabling resistance changes with a flashing "X icon". The meter remains precise for a change in cable resistance of up to 10% of the total combined installation resistance. Examples: No errors even with 80 Ohms cable resistance change with a single 700 Ohm cell and 100 Ohms cabling resistance, or 10 Ohms cable change with 4 x 350 Ohms in parallel and 20 Ohms cabling resistance. It reports open circuit or short circuit conditions. |
| Accuracy | +/- 0.025% of range |
| Temperature coefficient | +/- 25ppm/Deg C |
| Auto zero | Configurable threshold level and duration. |
| Linearisation | Selectable 3 to 32 calibration points. Function can be switched in and out. Separate from basic system calibration. |
| Filtering / Averaging | 4 pole active low pass filter, 7Hz cutoff. Additional user adjustable ramp time for a step change of 0.0 to 99.9 Seconds |
| Update Rate | Display updates 10 times per second |
| Count-by rounding | Can be user adjusted to count in increments of 1, 2, 5, 10, 20, 50 |
| Dead-load add / subtract | Fully adjustable to compensate for added or removed hardware. |
| Independent scale factor | Fully adjustable multiplying or dividing scale factor, which does not affect the basic calibration. Ideal for converting a scale from pounds to kilos, or bushels or ounces etc. |

Direct Calibration method:Direct calibration is more accurate, because it calibrates the whole system, including the sensor.1. Connect your sensor to the meter and to your process. You must be able to adjust the process to two precisely known values, ideally at 0% and 100% of your measurement range, but you can use any 2 well separated points. You will adjust the meter to read those two calibration values. 2. If the meter is locked, unlock the calibration menu 3. Press 'Cal Lo' and 'Cal Hi' together for 3 seconds until you see 'C.Src' (calibration source) 4. Press the △ or ▽ button repeatedly until you see: 'dir' then press 'OK'
Example Calibration: Calibrate the meter with an input signal range of 1.000 V to 9.000 V, to display 0.0 to 60.0 High Calibration point: In.Hi = 9.000 V rd.Hi = 60.0 Low Calibration point: InLo = 1.000 V rd.Lo = 0.0 We will also check the middle of the range at 5V input, to verify that the display shows 30.0 Method... High calibration point 1. Press 'Cal Hi' button for 3 seconds. 2. The display will say 'dir' to confirm you are in Direct calibration made, and will then say 'InHi'. 3. Apply the high level calibration signal 9.000V in the example, and press 'OK' 4. The display will now briefly say 'rd.Hi' to confirm you are in the High Reading setting. 5. To set decimal point position, press 'Cal Hi' button again for 3 seconds and move the decimal point to the desired position with △ or ▽ buttons. Press 'OK' to save. 6. Press 'Digit' button to select each digit and edit with the △ or ▽ buttons to show 60.0 or your desired high reading. Press 'OK' when all digits are correct. Low calibration point 7. Press 'Cal Lo' button for 3 seconds. 8. The display will say 'dir' to confirm you are in Direct calibration made, and will then say 'InLo'. 9. Apply the low level calibration signal 1.000V in the example, and press 'OK' 10. The display will now briefly say 'rd.Lo' to confirm you are in the Low Reading setting. 11. Press 'Digit' button to select each digit and edit with the △ or ▽ buttons to show 0.0 or your desired low reading. Press 'OK' when all digits are correct. 12. Apply 50% of input range, so 5.000V in the example and ensure the display reads 50% of display range, being 30.0 in the example. The meter will lock itself automatically within 5 minutes, or immediately, if you switch the meter off then on again. |
Theoretical Calibration method:Theoretical calibration allows you to define two input and corresponding display values, without needing to connect a sensor to the display.It is not as accurate as Direct calibration, because we do not include the sensor in the calibration, but it is useful as an approximate calibration method. 1. If the meter is locked, unlock the calibration menu 2. Press 'Cal Lo' and 'Cal Hi' together for 3 seconds until you see 'C.Src' (calibration source) 3. Press the △ or ▽ button repeatedly until you see: 'thEo' then press 'OK'
Example Calibration: Calibrate the meter with a theoretical input signal range of 2.000 V to 10.000 V, to display 0.0 to 75.0 High Calibration point: InHi = 8.750 V rdHi = 75.0 Low Calibration point: InLo = 2.000 V rdLo = 0.0 Method... High calibration point 1. Press 'Cal Hi' button for 3 seconds. 2. The display will say 'theo' to confirm you are in Direct calibration mode, and will then say 'InHi'. 3. It will then show the existing In.Hi value, which you can edit, as follows. 4. Press the 'Digit' button repeatedly, to highlight individual digits. 5. Edit each digit with the △ or ▽ buttons until 8.750 is shown (or your actual In.Hi value) and press 'OK' 6. rdHi will appear, then the existing rdHi value, which you can edit, as follows. 7. If you want to change the decimal point posision, press 'Cal Hi' button for 3 seconds and move the decimal point to the desired position with △ or ▽ buttons. 8. Press 'OK' to save. 9. Press the 'Digit' button repeatedly, to highlight individual digits. 10. Edit each digit with the △ or ▽ buttons to set 75.0 (or your actual rdHi value) and press 'OK' Low calibration point 11. Press 'Cal Lo' button for 3 seconds. 12. The display will say 'theo' to confirm you are in Direct calibration made, and will then say 'InLo'. 13. It will then show the existing InLo value, which you can edit, as follows. 14. Press the 'Digit' button repeatedly, to highlight individual digits. 15. Edit each digit with the △ or ▽ buttons until 2.000 is shown (or your actual InLo value) and press 'OK' 16. rdLo will appear, then the existing rdLo value, which you can edit, as follows. 17. Press the 'Digit' button repeatedly, to highlight individual digits. 18. Edit each digit with the △ or ▽ buttons to set 0.0 (or your actual rdLo value) and press 'OK' The meter will lock itself automatically within 5 minutes, or immediately, if you switch the meter off then on again. |
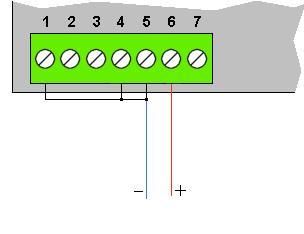
| Voltage Input signals | |
| -20.000V to +20.000V maximum functional range. | Input Impedance: 1 Megohm Open Circuit Response: 0V Safe Overload Limit: 60V DC CMRR: 110dB DC to 60Hz. Isolation: 250VAC |
| Sensor Excitation signals | |
| Voltage and Current |
Max. Excitation Voltage = 24V DC Max. Excitation Current = 30mA DC Both the excitation voltage and current are monitored and controlled by the meter. This allows the meter to provide flexible and precise compensation of cabling resistance, whilst maintaining the sensor's excitation at a level for best signal to noise ratio, depending on which sensor type you use. Changes in the sensor's excitation conditions allow the meter to give instant diagnostic messages. These help you to quickly identify and correct any external wiring or sensor faults which may occur during or after installation. |
Direct Calibration method:Direct calibration is more accurate, because it calibrates the whole system, including the sensor.1. Connect your sensor to the meter and to your process. You must be able to adjust the process to two precisely known values, ideally at 0% and 100% of your measurement range, but you can use any 2 well separated points. You will adjust the meter to read those two calibration values. 2. If the meter is locked, unlock the calibration menu 3. Press 'Cal Lo' and 'Cal Hi' together for 3 seconds until you see 'C.Src' (calibration source) 4. Press the △ or ▽ button repeatedly until you see: 'dir' then press 'OK'
Example Calibration: Calibrate the meter with an input signal range of 4.000mA to 20.000mA, to display 0.0 to 60.0 High Calibration point: In.Hi = 20.000 mA rd.Hi = 60.0 Low Calibration point: InLo = 4.000 mA rd.Lo = 0.0 We will also check the middle of the range at 12mA input, to verify that the display shows 30.0 Method ... High calibration point 1. Press 'Cal Hi' button for 3 seconds. 2. The display will say 'dir' to confirm you are in Direct calibration made, and will then say 'InHi'. 3. Apply the high level calibration signal 20.000mA in the example, and press 'OK' 4. The display will now briefly say 'rd.Hi' to confirm you are in the High Reading setting. 5. To set decimal point position, press 'Cal Hi' button again for 3 seconds and move the decimal point to the desired position with △ or ▽ buttons. Press 'OK' to save. 6. Press 'Digit' button to select each digit and edit with the △ or ▽ buttons to show 60.0 or your desired high reading. Press 'OK' when all digits are correct. Low calibration point 7. Press 'Cal Lo' button for 3 seconds. 8. The display will say 'dir' to confirm you are in Direct calibration made, and will then say 'InLo'. 9. Apply the low level calibration signal 4.000mA in the example, and press 'OK' 10. The display will now briefly say 'rd.Lo' to confirm you are in the Low Reading setting. 11. Press 'Digit' button to select each digit and edit with the △ or ▽ buttons to show 0.0 or your desired low reading. Press 'OK' when all digits are correct. 12. Apply 50% of input range, so 12.000mA in the example and ensure the display reads 50% of display range, being 30.0 in the example. The meter will lock itself automatically within 5 minutes, or immediately, if you switch the meter off then on again. |
Theoretical Calibration method:Theoretical calibration allows you to define two input and corresponding display values, without needing to connect a sensor to the display.It is not as accurate as Direct calibration, because we do not include the sensor in the calibration, but it is useful as an approximate calibration method. 1. If the meter is locked, unlock the calibration menu 2. Press 'Cal Lo' and 'Cal Hi' together for 3 seconds until you see 'C.Src' (calibration source) 3. Press the △ or ▽ button repeatedly until you see: 'thEo' then press 'OK'
Example Calibration: Calibrate the meter with a theoretical input signal range of 4.000 mA to 20.000 mA, to display 0.0 to 75.0 High Calibration point: InHi = 20.000 mA rdHi = 75.0 Low Calibration point: InLo = 4.000 mA rdLo = 0.0 Method... High calibration point 1. Press 'Cal Hi' button for 3 seconds. 2. The display will say 'theo' to confirm you are in Direct calibration mode, and will then say 'InHi'. 3. It will then show the existing In.Hi value, which you can edit, as follows. 4. Press the 'Digit' button repeatedly, to highlight individual digits. 5. Edit each digit with the △ or ▽ buttons until 20.000 is shown (or your actual In.Hi value) and press 'OK' 6. rdHi will appear, then the existing rdHi value, which you can edit, as follows. 7. If you want to change the decimal point posision, press 'Cal Hi' button for 3 seconds and move the decimal point to the desired position with △ or ▽ buttons. 8. Press 'OK' to save. 9. Press the 'Digit' button repeatedly, to highlight individual digits. 10. Edit each digit with the △ or ▽ buttons to set 75.0 (or your actual rdHi value) and press 'OK' Low calibration point 11. Press 'Cal Lo' button for 3 seconds. 12. The display will say 'theo' to confirm you are in Direct calibration made, and will then say 'InLo'. 13. It will then show the existing InLo value, which you can edit, as follows. 14. Press the 'Digit' button repeatedly, to highlight individual digits. 15. Edit each digit with the △ or ▽ buttons until 4.000 is shown (or your actual InLo value) and press 'OK' 16. rdLo will appear, then the existing rdLo value, which you can edit, as follows. 17. Press the 'Digit' button repeatedly, to highlight individual digits. 18. Edit each digit with the △ or ▽ buttons to set 0.0 (or your actual rdLo value) and press 'OK' The meter will lock itself automatically within 5 minutes, or immediately, if you switch the meter off then on again. |
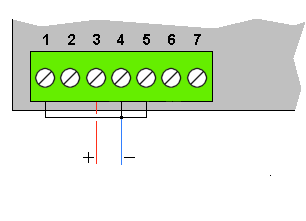
| Current Input signals | |
| -40.000 to +40.000mA maximum functional range | Input Impedance: 2.5 Ohms Open Circuit Response: 0mA Safe Overload Limit: High current capacity up to 30V DC permanently applied across current input terminals. The input shunt resistors are automatically protected from accidental connection to high current 24V DC supplies or other potentially damaging signals. CMRR: 110dB DC to 60Hz. Isolation: 250VAC |
| Sensor Excitation signals | |
| Voltage and Current |
Max. Excitation Voltage = 24V DC Max. Excitation Current = 30mA DC Both the excitation voltage and current are monitored and controlled by the meter. This allows the meter to provide flexible and precise compensation of cabling resistance, whilst maintaining the sensor's excitation at a level for best signal to noise ratio, depending on which sensor type you use. Changes in the sensor's excitation conditions allow the meter to give instant diagnostic messages. These help you to quickly identify and correct any external wiring or sensor faults which may occur during or after installation. |
| 1° | 1 deg resolution |
| 0.1° | 0.1 deg resolution |
|
| This video shows how to set up your PT100 display. |
Direct Calibration method:Direct calibration is more accurate, because it calibrates the whole system, including the shunt.1. Connect your shunt to the meter and to your process. You must be able to adjust the process to two precisely known current values, ideally at 0% and 100% of your measurement range, but you can use any 2 well separated points. You will adjust the meter to read those two calibration values. 2. If the meter is locked, unlock the calibration menu 3. Press 'Cal Lo' and 'Cal Hi' together for 3 seconds until you see 'C.Src' (calibration source) 4. Press the △ or ▽ button repeatedly until you see: 'dir' then press 'OK'
Example Calibration: Calibrate the meter with an input signal range of 0A to 250 A to the shunt, to display 0.0 to 250.0 High Calibration point: In.Hi = 250 A rd.Hi = 250.0 Low Calibration point: InLo = 0 A rd.Lo = 0.0 We will also check the middle of the range at 125 A input, to verify that the display shows 125.0 Method ... High calibration point 1. Press 'Cal Hi' button for 3 seconds. 2. The display will say 'dir' to confirm you are in Direct calibration made, and will then say 'InHi'. 3. Apply the high level calibration signal 250A in the example, and press 'OK' 4. The display will now briefly say 'rd.Hi' to confirm you are in the High Reading setting. 5. To set decimal point position, press 'Cal Hi' button again for 3 seconds and move the decimal point to the desired position with △ or ▽ buttons. Press 'OK' to save. 6. Press 'Digit' button to select each digit and edit with the △ or ▽ buttons to show 250.0 or your desired high reading. Press 'OK' when all digits are correct. Low calibration point 7. Press 'Cal Lo' button for 3 seconds. 8. The display will say 'dir' to confirm you are in Direct calibration made, and will then say 'InLo'. 9. Apply the low level calibration signal 0 A in the example, and press 'OK' 10. The display will now briefly say 'rd.Lo' to confirm you are in the Low Reading setting. 11. Press 'Digit' button to select each digit and edit with the △ or ▽ buttons to show 0.0 or your desired low reading. Press 'OK' when all digits are correct. 12. Apply 50% of input range, so 125 A in the example and ensure the display reads 50% of display range, being 125.0 in the example. The meter will lock itself automatically within 5 minutes, or immediately, if you switch the meter off then on again. |
Theoretical Calibration method:Theoretical calibration allows you to define two input and corresponding display values, without needing to connect a shunt to the display.It is not as accurate as Direct calibration, because we do not include the shunt in the calibration, but it is useful as an approximate calibration method. 1. If the meter is locked, unlock the calibration menu 2. Press 'Cal Lo' and 'Cal Hi' together for 3 seconds until you see 'C.Src' (calibration source) 3. Press the △ or ▽ button repeatedly until you see: 'thEo' then press 'OK'
Example Calibration: In this example, we will use a 400 A shunt, giving 0-60mV Calibrate the meter with a theoretical input signal range of 0.000 mV to 60.000 mV, to display 0.0 to 400.0 A High Calibration point: InHi = 60.000 mV rdHi = 400.0 Low Calibration point: InLo = 0.000 mV rdLo = 0.0 Method... High calibration point 1. Press 'Cal Hi' button for 3 seconds. 2. The display will say 'theo' to confirm you are in Direct calibration mode, and will then say 'InHi'. 3. It will then show the existing In.Hi value, which you can edit, as follows. 4. Press the 'Digit' button repeatedly, to highlight individual digits. 5. Edit each digit with the △ or ▽ buttons until 60.000 is shown (or your actual In.Hi value) and press 'OK' 6. rdHi will appear, then the existing rdHi value, which you can edit, as follows. 7. If you want to change the decimal point posision, press 'Cal Hi' button for 3 seconds and move the decimal point to the desired position with △ or ▽ buttons. 8. Press 'OK' to save. 9. Press the 'Digit' button repeatedly, to highlight individual digits. 10. Edit each digit with the △ or ▽ buttons to set 400.0 (or your actual rdHi value) and press 'OK' Low calibration point 11. Press 'Cal Lo' button for 3 seconds. 12. The display will say 'theo' to confirm you are in Direct calibration made, and will then say 'InLo'. 13. It will then show the existing InLo value, which you can edit, as follows. 14. Press the 'Digit' button repeatedly, to highlight individual digits. 15. Edit each digit with the △ or ▽ buttons until 0.000 is shown (or your actual InLo value) and press 'OK' 16. rdLo will appear, then the existing rdLo value, which you can edit, as follows. 17. Press the 'Digit' button repeatedly, to highlight individual digits. 18. Edit each digit with the △ or ▽ buttons to set 0.0 (or your actual rdLo value) and press 'OK' The meter will lock itself automatically within 5 minutes, or immediately, if you switch the meter off then on again. |
| Voltage Input signals | |
| -100.50mV to +100.50mV maximum functional range. | Input Impedance: 10 Megohm Open Circuit Response: -0r- Upscale Safe Overload Limit: 60V DC CMRR: 110dB DC to 60Hz. Isolation: 250VAC |
| Accuracy | +/- 0.05% of range |
| Stability | +/- 50ppm/Degree C |
| Menu | Name | Standard Usage | Intrinsically Safe |
| tc b | Type B |  |  |
| tc E | Type E |  |  |
| tc J | Type J |  |  |
| tc k | Type K |  |  |
| tc n | Type N |  |  |
| tc r | Type R |  |  |
| tc S | Type S | | |
| tc t | Type T |  |  |
| 1° | 1 deg resolution |
| 0.1° | 0.1 deg resolution |
| Standard Meter: |
Thermocouples All can be set for Deg. C, Deg. F, Deg. K or Deg. R All can be set for 1 or 0.1 Deg Resolution All cover the standard full range of the sensor Thermocouple Type B: +250 to 1700 Deg C Thermocouple Type E: -270 to 1000 Deg C Thermocouple Type J: -210 to + 760 Deg C Thermocouple Type K: -200 to + 1300 Deg C Thermocouple Type N: -200 to + 1280 Deg C Thermocouple Type R: -40 to + 1480 Deg C Thermocouple Type S: -50 to + 1600 Deg C Thermocouple Type T: -200 to + 370 Deg C Automatic or fixed user-specified cold-junction temperature. |
| Precison | +/- 0.5 degrees C max linearity error. CJ Error less than 0.1 degree per degree of ambient change. |
|
| This video shows how to set up your thermocouple display. |
|
| This video shows how to calibrate without an input signal (theoretical calibration). |
|
| This video shows how to calibrate with an input signal (direct calibration).. |
|
|
This video demonstrates the power frequency display, compared to a UK online grid frequency reference at http://mainsfrequency.uk/fm-fullscreen |
| Low Ranges | ||
| Range | Screen Prompt | Excitation Current |
| 1 Ohm max. | 1 r | 50mA |
| 10 Ohm max. | 10 r | 5mA |
| 100 Ohm max. | 100r | 0.5mA |
| High Ranges | ||
| Range | Screen Prompt | Excitation Current |
| 1 kilOhm max. | 1 th (1 thousand) | 50uA |
| 10 kilOhm max. | 10th (10 thousand) | 5uA |
| 40 kilOhm max. | 40th (40 thousand) | 1.25uA |
| Range | Display resolution |
| 1 Ohm max. | 0 - 999.9 mOhms |
| 10 Ohm max. | 0.000 to 9.999 Ohms |
| 100 Ohm max. | 0.00 to 99.99 Ohms |
| 1 kilOhm max. | 0.0 to 999.9 Ohms |
| 10 kilOhm max. | 0 to 9999 Ohms |
| 40 kilOhm max. | 0 to 40.00 kilOhms |
|
| This video shows how to configure your Resistance display. |
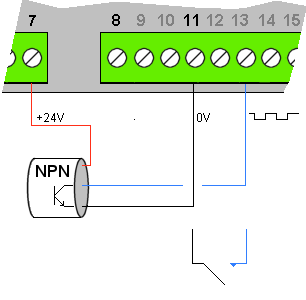
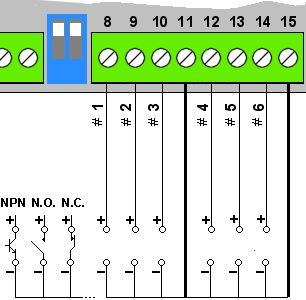
| Signal Types | |
| NPN Transistors | Switching 5V DC at 1mA Must saturate to lower than 1V Vce |
| Normally Open Contacts | Switching 5V DC at 1mA We recommend you use wiping contacts, to mechanically clear any oxidation or tarnishing of the contact surfaces. |
| Normally Closed Contacts | Switching 5V DC at 1mA We recommend you use wiping contacts, to mechanically clear any oxidation or tarnishing of the contact surfaces. |
| De-bounce | Each input port has its own configurable de-bounce time which you can adjust to suit your application. Range 0 to 9999 milli-seconds. |
|
|
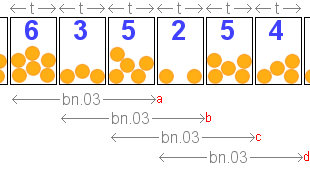
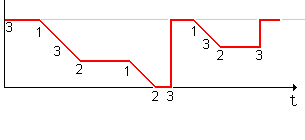
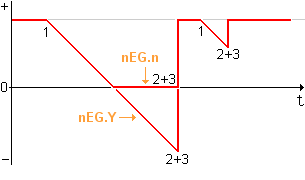
This video demonstrates how to configure your Rate display We set ... P.in = 5 disp = 1.000 bn.10 t.010 SCAL = Mult 0.500 dbnc = 0500 The configuration lockout switch must be off. |


| Signal Types | |
| NPN Transistors | Switching 5V DC at 1mA Must saturate to lower than 1V Vce |
| Normally Open Contacts | Switching 5V DC at 1mA We recommend you use wiping contacts, to mechanically clear any oxidation or tarnishing of the contact surfaces. |
| Normally Closed Contacts | Switching 5V DC at 1mA We recommend you use wiping contacts, to mechanically clear any oxidation or tarnishing of the contact surfaces. |
| De-bounce | Each input port has its own configurable de-bounce time which you can adjust to suit your application. Range 0 to 9999 milli-seconds. |
|
| This video shows how to set up your timer display. |
| Max. pulse input frequency | dbnc |
| 1 pulse per sec. max. | 500 |
| 10 pulses per sec. max. | 50 |
| 100 pulses per sec. max. | 5 |
| More than 100 pulses per sec. | 0 |
|
|
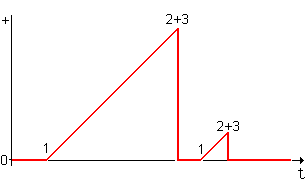
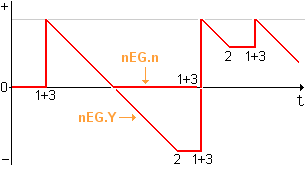
This video demonstrates how to adjust your totaliser for 10 input pulses to display 1.5 counts, with debounce time of 500 mS. The configuration lockout switch must be off. |
|
|
This video shows how to select type CL We then select one of the clock modes. In this example, we will view all the modes and will select H.M.S. |
|
|
This video shows how to adjust your clock to a precision time reference. In this example, we use the Clock page of the meter's online operating manual, which has a precision time reference. Unlock the meter and press Buttons 1, 2 and 3 together for 3 seconds. You can set Year , Month, Date, HH and MM. Set MM to one minute ahead of actual time, then press Button 4. The green Alarm LEDs will flash. As soon as the time reference reaches this time, press button 4 to synchronise the clock. |
|
|
This video shows how to fit the clock board option into your meter. 1. Remove the fastening screw on lower surface. There may be one on the upper surface also, if the meter has output option modules fitted. 2. Remove the front panel 3. Slide the circuit board forward, out of the case. 4. Remove the spare screw from the pillar on the clock board and plug the board onto the row of pins each side of the processor. 5. Turn the main board over and place the screw from the pillar into the hole shown and tighten the screw. 6. Slide the board into the case and re-fit the screw on the lower surface. 7. Re-fit the front panel to the case. 8. To enable the clock, apply power and select type CL. 9. Set the mode you require and check that it operates as you wish. |
| Time reference | Internal crystal oscillator |
| Summer/Winter correction |
Automatic summer/winter time correction Can be disabled to show GMT / UTC / Zulu time Has internal calendar for European and US time zone changeovers. |
| Available formats |
HH:MM:SS (HH:MM on 4 digit displays) DD.MM.YY calendar DDD days |
| Precision |
+/- 10 seconds per month |
| Step | Test Weight (kg) | Displayed value (kg) |
| 1: | 0.0 | 0.0 |
| 2: | 100.0 | 100.2 |
| 3: | 200.0 | 200.5 |
| 4: | 300.0 | 300.3 |
| 5: | 400.0 | 400.1 |
| 6: | 500.0 | 500.1 |
| Step | Test Weight (kg) | Displayed value (kg) |
| 7: | 500.0 | 500.1 |
| 8: | 400.0 | 400.1 |
| 9: | 300.0 | 300.3 |
| 10: | 200.0 | 200.5 |
| 11: | 100.0 | 100.2 |
| 12: | 0.0 | 0.0 |
| Un-linearised Value | Desired Value | |||
| 1: | In.01 | 0.0 | rd.01 | 0.0 |
| 2: | In.02 | 100.2 | rd.02 | 100.0 |
| 3: | In.03 | 200.5 | rd.03 | 200.0 |
| 4: | In.04 | 300.3 | rd.04 | 300.0 |
| 5: | In.05 | 400.1 | rd.05 | 400.0 |
| 6: | In.06 | 500.1 | rd.06 | 500.0 |
|
| This video demonstrates how to linearise your meter, using the example settings described on this page. |
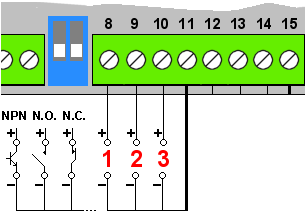
| Signal Types | |
| NPN Transistors | Switching 5V DC at 1mA Must saturate to lower than 1V Vce |
| Normally Open Contacts | Switching 5V DC at 1mA We recommend you use wiping contacts, to mechanically clear any oxidation or tarnishing of the contact surfaces. |
| Normally Closed Contacts | Switching 5V DC at 1mA We recommend you use wiping contacts, to mechanically clear any oxidation or tarnishing of the contact surfaces. |
| De-bounce | Each input port has its own configurable de-bounce time which you can adjust to suit your application. Range 0 to 9999 milli-seconds. |
|
| This video demonstrates how to edit your contact closure functions. |
| Press the △ or ▽ button repeatedly to go up and down this list. |
NEtt. The real-time nett value GroS. The real-time gross value PEA.g. The memorised maximum gross value VAL.g. The memorised minimum gross value PEA.n. The memorised maximum nett value VAL.n. The memorised minimum nett value tArE. The real-time tare value CJ t. The real-time on-board temperature |
|
| This video shows how to adjust the analogue output. |
|
| This video shows how to install an analog output board. |
| How to install | This is a plug-in module which you can add to your meter at any time. You do not need special tools or software |
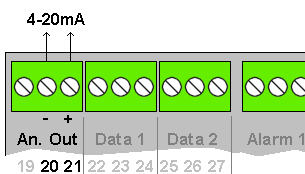
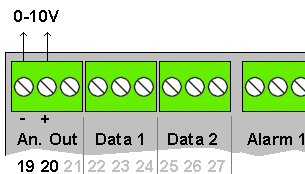
| Available outputs | Select 0-20mA, 4-20mA (active or passive) or 0-10V |
| Drive resistance 20mA Active | Can drive into loads from 0 Ohms to 600 Ohms, using the Active output terminals. 16V DC open circuit output. |
| Drive resistance 20mA Passive | Can modulate loops from 0 Ohms to 1000 Ohms, using the Passive output terminals. 24V DC external drive voltage |
| Drive resistance 0-10V | Can drive into loads greater than 600 Ohms. 30mA short circuit current. |
| Scaling method | Define display value for 0mA, 4mA or 0V Define display value for 20mA or 10V |
| Data which generates the analogue output | Choose which data your Analogue output will be derived from: 1. Nett Value 2. Gross Value 3. Peak Gross value 4. Valley Gross value 5. Peak Nett value 6. Valley Nett value 7. Tare Value 8. CJT on-board temperature |
| Galvanic Isolation | Optically isolated from all ports up to 250 VAC |
| Proportionality | You can scale the analogue output as directly proportional or inversely proportional. For example, directly proportional: 0 to 50 000 kg on the display produces 4 to 20mA output. Inversely proportional: 0 to 50 000 kg on the display produces 20 to 4mA output. |
| Response speed | Updates 10 times per second. |
| Resolution | 18 bit resolution |
| Precision | +/- 0.05% of range |
| Temperature stability | +/- 50ppm of range, per Deg C |
|
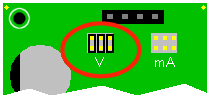
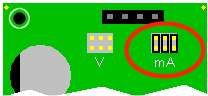
| This video shows how to access and move the switches on the analogue output board, to select either current or voltage output. |
|
| This video shows how to adjust the analogue output. |
|
| This video shows how to install an analog output board. |
| How to install | This is a plug-in module which can be added to your meter at any time. No special tools or software needed. |
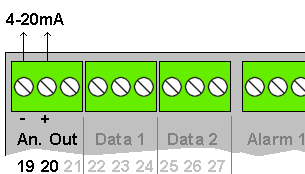
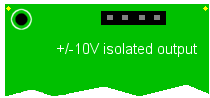
| Available outputs | Fixed as -10V to +10V |
| Drive resistance 0-10V | Can drive into loads greater than 600 Ohms. 30mA short circuit current. |
| Scaling method | Define display reading for -10V Define display reading for +10V |
| Source of data used to create analogue output | Analogue output can be derived from one of several data sources which you can choose from: 1. Display value (default) 2. Nett Value 3. Gross Value 4. Tare Value 5. Raw A/D |
| Galvanic Isolation | Optically isolated from all ports up to 250 VAC |
| Proportionality | You can freely scale the analogue output as directly proportional of inversely proportional. For example, directly proportional could be -50 000 to 50 000 kN on the display produces -10 to +10V output. Inversely proportional could be -50 000 to 50 000 kN on the display produces +10 to -10V output. |
| Response speed | Updates 10 times per second. |
| Resolution | 18 bit resolution |
| Precision | +/- 0.05% of range |
| Temperature stability | +/- 50ppm of range, per Deg C |

| How to install | This is a plug-in module which can be added to your meter at any time. No special tools or software needed. |
| Available outputs |
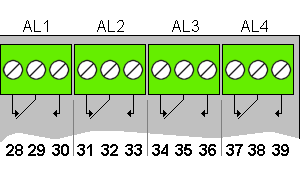
Option SPCO:
4 x Mechanical Relays Single Pole Change Over Device = PE515005 Rated 2A 250VAC Resistive Option SSAC: 4 x Solid State AC Relays Single Pole Single Throw Device = TLP3063 Rated 100mA 250VAC Resistive Option SSDC: 4 x Solid State DC Relays Single Pole Single Throw Device = AQV112KL Resistance: 2 Ohms Maximum Rated 500 mA 60 VDC Resistive |
| Available combinations | 0, 1 or 2 x Serial comms output Options can be installed, which may be RS232 or RS485, in any combination, as well as any or no analogue output. |
| Isolation | Optically isolated from all ports up to 250 VAC |
| Speed | Updates 10 times per second, mechanical response 15mS You can also specify a minimum amount of time the signal needs to be in alarm for, before the relay will change state. Settable 0-99 seconds You can also specify a minimum amount of time the signal needs to be out of alarm for, before the relay will change state. Settable 0-99 seconds |
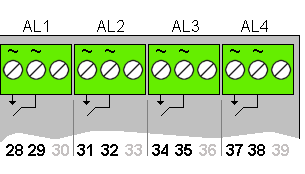
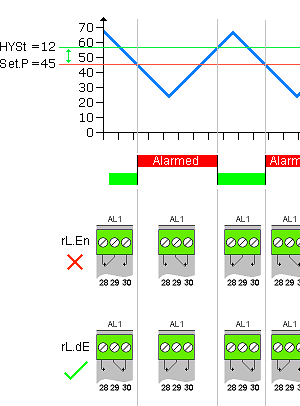
| Relay states | The relay can be set to energise or de-energise on alarm. Relays will de-energise on loss of power to the meter or on loss of communication from the microprocessor. |
| Hysteresis | The hysteresis is unidirectional and can be set from 0 to 999999 |
|
| This video demonstrates how to install an alarm output board. |
|
|
This video demonstrates how to set up a Hi Alarm for alarm channel 2. |

|
|
This video demonstrates how to set up a Lo Alarm for alarm channel 2. |
|
|
This video demonstrates how to set up a Hi Alarm for alarm channel 2. |
|
|
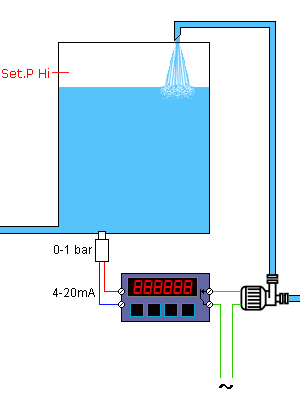
This video demonstrates how to set up a Low Pump Control Alarm for alarm channel 2. |

|
| This video shows how to set up your serial output in C1 mode. |
|
|
This video shows how to set up your serial output in P1 mode. It also shows us using RealTerm to communicate with the meter. |
| Installation | These are plug-in modules which you can add to your meter at any time. | ||||||||||||||||
| Combinations | Any combination of 0 or 1 extra serial outputs, 0 or 1 analogue output, 0 or 4 alarm outputs | ||||||||||||||||
| Galvanic Isolation | Optically isolated from all ports up to 250 VAC | ||||||||||||||||
| Source of data | Select one of these data sources: 1. Display value (default) 2. Nett Value 3. Maximum Nett Value 4. Minimum Nett Value 5. Gross Value 6. Maximum Gross Value 7. Minimum Gross Value 8. Tare Value 9. Meter temperature | ||||||||||||||||
| Response speed | Updates up to 10 times per second, depending on chosen baud rate. | ||||||||||||||||
| Repetition Delay | Can be set 0.1 to 99.9 seconds in protocol C1 | ||||||||||||||||
| Comms type | RS232 = Full duplex RS485 = half duplex | ||||||||||||||||
| Baud rates | 300,600,1200,2400,4800 9600,19200,38400,115200 | ||||||||||||||||
| Address Range | 2 byte address, 01 to FE , 254 addresses available | ||||||||||||||||
| Data formats |
701 = 7 data bits, Odd Parity, 1 Stop bit 7E1 = 7 data bits, Even Parity, 1 Stop bit 7N2 = 7 data bits, No Parity, 2 Stop bits 801 = 8 data bits, Odd Parity, 1 Stop bit 8E1 = 8 data bits, Even Parity, 1 Stop bit 8N1 = 8 data bits, No Parity, 1 Stop bit | ||||||||||||||||
| ASCII Output message formats |
Meter sends <STX> 8 characters <ETX> Examples: Negative value with decimal point 02 20 20 20 20 2D 31 2E 36 03 (-1.6) Positive value with decimal point 02 20 20 20 20 20 31 2E 38 03 (+1.8) Open circuit 02 20 20 20 20 2D 4F 43 2D 03 (-OC-) Short circuit 02 20 20 20 20 2D 53 43 2D 03 (-SC-) Display over range 02 20 20 64 2E 6F 2E 72 2E 03 (d.o.r.) Display under range 02 20 20 64 2E 75 2E 72 2E 03 (d.u.r.) Input over range 02 20 20 69 2E 6F 2E 72 2E 03 (i.o.r.) Input under range 02 20 20 69 2E 75 2E 72 2E 03 (i.u.r.) | ||||||||||||||||
| Protocols |
C1 = Continuous to slave display, or on demand via contact closure for printer H1 = GPS Receiver protocol P1 = Polled, addressable, Responds to London messaging syntax Request format: <Start Char> <Addr> <Request> <End Char> For example: <STX>01g<ETX> will ask meter with address '01' to send its Gross value In HEX, this will be \x02\z30\x31\x67\x03 if <STX> = \x02 and if <ETX> = \x03 . You can configure <STX> and <ETX> to be your own preferred HEX values. Request identifiers: d (hex 64) = displayed value n (hex 6E) or r (hex 72) = nett g (hex 67) or R (hex 52) = gross J (hex 4A) = Junction temperature at rear of meter p (hex 70) = nett peak P (hex 50) = gross peak v (hex 76) = nett valley V (hex 56) = gross valley t (hex 74) = tare value P2 = Polled, addressable, Responds to Modbus ASCII messaging syntax P3 = Polled, addressable, Responds to Modbus RTU messaging syntax
The values are provided in 32-bit IEEE-754 floating point format. |
| HEX | Character | Notes |
| \x00 | NUL | Null |
| \x02 | STX | Start Character |
| \x03 | ETX | End Character |
| \x04 | EOT | End of Transmission |
| \x09 | TAB | Horizontal Tab |
| \x0A | LF | Line Feed |
| \x0D | CR | Carriage Return |
| \x1B | ESC | Escape |
| \x20 | Space | |
| \x21 | ! | Exclamation |
| \x2B | + | Plus |
| \x2C | , | Comma |
| \x2D | - | Minus |
| \x2E | . | Decimal point |
| \x2F | / | Forward slash |
| \x30 | 0 | Zero |
| \x31 | 1 | One |
| \x32 | 2 | Two |
| \x33 | 3 | Three |
| \x34 | 4 | Four |
| \x35 | 5 | Five |
| \x36 | 6 | Six |
| \x37 | 7 | Seven |
| \x38 | 8 | Eight |
| \x39 | 9 | Nine |
| \x3A | : | Colon |
| \x3B | ; | Semi-colon |
| \x3C | < | Less Than |
| \x3D | = | Equals |
| \x3E | > | Greater Than |
| \x3F | ? | Question Mark |
| \x40 | @ | Ampersand |
| \x41 | A | |
| \x42 | B | |
| \x43 | C | |
| \x44 | D | |
| \x45 | E | |
| \x46 | F | |
| \x47 | G | |
| \x48 | H | |
| \x49 | I | |
| \x4A | J | |
| \x4B | K | |
| \x4C | L | |
| \x4D | M | |
| \x4E | N | |
| \x4F | O | |
| \x50 | P | |
| \x51 | Q | |
| \x52 | R | |
| \x53 | S | |
| \x54 | T | |
| \x55 | U | |
| \x56 | V | |
| \x57 | W | |
| \x58 | X | |
| \x59 | Y | |
| \x5A | Z | |
| \x5E | ^ | Caret |
| \x61 | a | |
| \x62 | b | |
| \x63 | c | |
| \x64 | d | |
| \x65 | e | |
| \x66 | f | |
| \x67 | g | |
| \x68 | h | |
| \x69 | i | |
| \x6A | j | |
| \x6B | k | |
| \x6C | l | |
| \x6D | m | |
| \x6E | n | |
| \x6F | o | |
| \x70 | p | |
| \x71 | q | |
| \x72 | r | |
| \x73 | s | |
| \x74 | t | |
| \x75 | u | |
| \x76 | v | |
| \x77 | w | |
| \x78 | x | |
| \x79 | y | |
| \x7A | z | |
| \x7F | DEL |
| Sensor type | Solid State silicon chip |
| Resolution | 0.01 deg. Centigrade |
| Range | -20 to +60 deg. C |
| Accuracy | +/- 0.25 Degrees C |
| Update Rate | 10 readings per second |
| Time constant | 1 minute |
|
| This video shows how to view the ambient temperature of your meter. |
| 1. | 3D STEP Files - all | [Case_STEP_Files.zip] |
| 2. | 3D Meter Case | [int_meter_main.STEP] |
| 3. | 3D Sealing gasket | [int_meter_gasket.STEP] |
| 4. | 3D Splashproof cover | [int_meter_cover.STEP] |
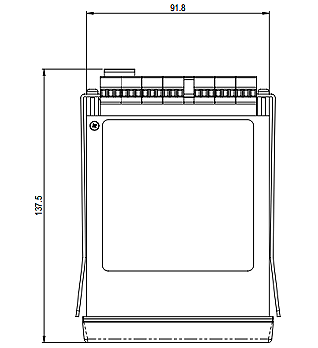
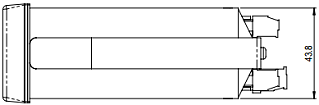
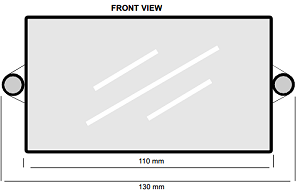
| Case Dimensions | |
| Frontal Area | 96 mm wide x 48 mm high |
| Cutout size | 92 mm wide x 45 mm high |
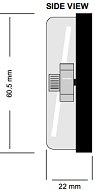
| Projection in front of panel | 13 mm |
| Projection behind panel | 125 mm |
| Max Width behind panel | 100 mm |
| Max. Weight - all options installed | 360 grams |
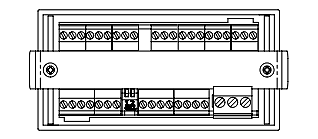
| Screw Terminal Connectors | |
| Function Identification | Label adjacent to each connector identifies terminal number or function. |
| Power | 1 x Plug-In 3 pin colour-coded connector. Cable exits below connector. Use 3.2mm flat bladed terminal screw driver |
| Signal/Control | Plug-In Green connector Cable exits below connector on bottom row Cable exits above connector on top row Use 2.4mm flat bladed terminal screw driver |
| Environmental | |
| Front Sealing | IP65 standard, IP67 with option SPC4 |
| Rear Sealing | IP20 |
| Case Material | Polycarbonate - Black |
| Cleaning | Use only damp cloth moistened with water. |
| Storage Temperature | -25 to +60C |
| Operating Temperature | -25 to +50C |
| Humidity | 10 to 95% non condensing |
| Altitude | -1000m to + 3000m |
| Vibration/Shock | 0-5G, less than 200Hz. |
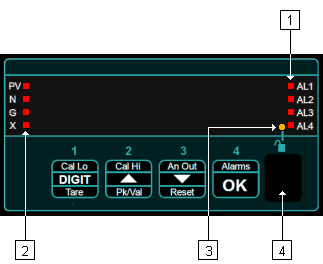
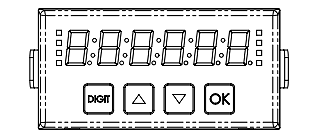
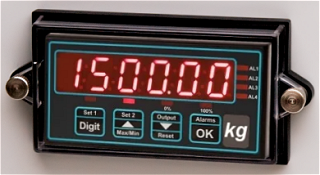
| Display | |
| Technology | Tri-Colour LED |
| Digits | Format is 8.:8.:8:.8.:8.:8. Update Rate: 10 per second Colour: Selectable Red, Yellow or Green Digit Height: 14.2mm Reading distance: 7 metres max. NB We make large digit versions of this display for indoor and outdoor viewing, in many digit sizes, for viewing up to 150 metres / 450 feet away. Brightness: 8 selectable brightness levels |
| Annunciators |
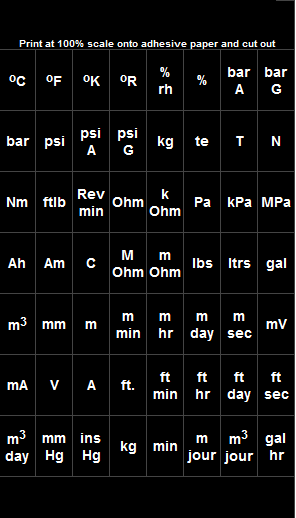
4 x 3 colour alarm annunicators 4 x 3 colour display annunicators 1 x 3 colour lock-status annunicator 1 x text area for printed units of measure label |
| MTBF | ||||||||||||||||||||||
| Reliability | Figures at 50% rh. All options installed in meter Effect of Ambient Temperature on MTBF:
| |||||||||||||||||||||
|
|
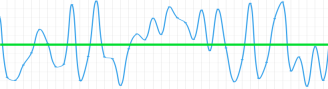
This video demonstrates how to adjust the stabilisation. Compare the stability of the display before and after the adjustment. |
|
|
This video demonstrates how to change the count-by resolution, with several examples with 10 000 kg load on a weighing platform. |
|
|
This video demonstrates how to change the offset, with two examples. Our basic calibration is 0.00 to 5.00 kg First we will add a positive offset of 2.00 Then we will subtract an offset of 1.70 |
|
|
This video demonstrates how to change the scaling. The first example will show how to multiply by 2.000 The second example will show how to divide by 2.000. |
|
|
This video demonstrates how to adjust the automatic drift cancellation. In this example, we will accept up to 5 counts of drift, and we check for drift every 10 seconds. Any drift up to and including 5 counts will be automatically re-set to 0. Any movement greater than 5 counts within 10 seconds will be considered as a valid process change and will not be re-set. When you have finished, you must move the rear calibration lockout switch to ON, to allow the drift correction to function. The video shows several corrections and it demonstrates that a process change larger than 5 counts is not affected. |
|
|
This video demonstrates the display hold (freeze) feature. In this example, we add it to contact closure input 2 |
|
|
This video demonstrates the Tare feature. In this example, we add it to contact closure input 2 |
|
|
This video demonstrates the Reset feature. In this example, we add it to contact closure input 2 |
|
|
This video demonstrates the display Peak feature. In this example, we add it to contact closure input 2 |
|
|
This video demonstrates the display Valley feature. In this example, we add it to contact closure input 2 |
|
|
This video demonstrates the display Show Nett feature. In this example, we add it to contact closure input 2 |
|
|
This video demonstrates the display Show Gross feature. In this example, we add it to contact closure input 2 |
|
|
This video demonstrates the display Heads-Up feature. In this example, we add it to contact closure input 2 |
| MTBF | ||||||||||||||||||||||
| Reliability | Figures at 50% rh. All options installed in meter Effect of Ambient Temperature on MTBF:
| |||||||||||||||||||||
| Legend | Description |
|---|---|
| 19.2 | 19200 baud |
| 38.4 | 38400 baud |
| 115.2 | 115200 baud |
| 300 | 300 baud |
| 600 | 600 baud |
| 1200 | 1200 baud |
| 2400 | 2400 baud |
| 4800 | 4800 baud |
| 9600 | 9600 baud |
| °C | Degrees Centigrade / Celcius readout, when thermocouple or PT100 sensor is used. |
| °F | Degrees Fahrenheit readout, when thermocouple or PT100 sensor is used. |
| °K | Degrees Kelvin readout, when thermocouple or PT100 sensor is used. |
| °r | Degrees Rankine readout, when thermocouple or PT100 sensor is used. |
| 0-20 | 0-20mA input |
| 0.1° | 0.1 degree Resolution of display, when thermocouple or PT100 sensor is used. |
| 1° | 1 degree Resolution of display, when thermocouple or PT100 sensor is used. |
| 10_u | 10V input |
| 100r | 100 Ohm range |
| 10r | 10 Ohm range |
| 10th | 10000 Ohm range |
| 12Hr | 12 Hour clock format |
| 1r | 1 Ohm range |
| 1th | 1000 Ohm range |
| 20th | 20000 Ohm range |
| 24Hr | 24 Hour clock format |
| 4-20 | 4-20mA input |
| 7E1 | 7 data bits Even parity 1 stop bit |
| 8E1 | 8 data bits Even parity 1 stop bit |
| 7n2 | 7 data bits No parity 2 stop bits |
| 7o1 | 7 data bits Odd parity 1 stop bit |
| 8n1 | 8 data bits No parity 1 stop bit |
| 8o1 | 8 data bits Odd parity 1 stop bit |
| A.CFG | Alarm Configuration |
| Ad_0 | Address 0 port, for multi page memory |
| Ad_1 | Address 1 port, for multi page memory |
| Ad.__ | Address You can set an address from 00 to FF |
| AdC_ | ADC value, show on display |
| Auto | Automatic cold junction compensation for thermocouple inputs. |
| bAud | Baud rate |
| biP | Bipolar signal |
| bn.__ | Bin number Used in averaging of pulsed production rate. Sets a number of bins to be averaged. Each bin has as a defined open-time during which pulses can be entered into it. |
| C.Src | Calibration source |
| CC_1 | Contact Closure input 1 |
| CC_2 | Contact Closure input 2 |
| CC_3 | Contact Closure input 3 |
| CC_4 | Contact Closure input 4 |
| CC_5 | Contact Closure input 5 |
| CC_6 | Contact Closure input 6 |
| CJ t | Cold Junction Temperature. |
| CJ-- | Fixed cold junction compensation with definable temperature, for thermocouple inputs. |
| CL | Clock function |
| Cnt_ | Count |
| CoL.G | Allows setting of display colour to Green |
| CoL.r | Allows setting of display colour to Red |
| CoL.Y | Allows setting of display colour to Yellow |
| d.FNt | Data format. When you see this, you will have the otion to select one of several data fomats |
| d.o.r. | Display Over Range. The positive number being sent to the display has more digits than the display. |
| d.tAr | Display Tare |
| d.u.r. | Display Under Range. The negative number being sent to the display has more digits than the display. |
| dAt.1 | Data Port 1 |
| dAt.2 | Data Port 2 |
| dbnc | Debounce filter for contact closure input, set in milliseconds. Prevents multiple input pulses from being processed, when only 1 was intended. |
| dEF.n | Defaults - No? Do you NOT want to set the meter to its factory defaults? Press OK if you do NOT want to set factory defaults. |
| dEF.Y | Defaults - Yes? Do you want to set the meter to its factory defaults? Press OK if you do. |
| dig.4 | Used to set the meter with a 4 digit format. Normally only used if you have a 4 digit large display version. |
| dig.6 | Used to set the meter with a 6 digit format. |
| dir_ | Direct Calibration You must apply signals to the meter and set the required display value for each signal level you apply. |
| DiSP | Display Lets you choose which parameter to show on the display, by default. |
| dIU | Division This is the Scale factor choice. For example, if the scale factor is 3 and you chose DIV, all readings will be divided by 3 |
| dn | Counter mode = Down (total decreases) |
| drF.0 | Drift Cancellation turned off |
| drF.1 | Drift cancellation turned on |
| drF.A | Drift cancellation Amount threshold. |
| drF.t | Drift cancellation sampling time interval. |
| dSt | Daylight saving time compensation choices. |
| dt.__ | Date (day). Used when setting the calendar. Now it is date 22 |
| E.CC.n | External contact closures define - Yes? |
| E.CC.Y | External contact closures define - No? |
| Ec.__ | End Character You can set a HEX end character for a data stream. For example 03=ETX |
| ELAP | Elapsed timer. Count up or count down |
| Err | Error |
| EU | European daylight saving calendar. |
| Fbr.0 | Front Button Reset (button3) - disabled |
| Fbr.1 | Front Button Reset (button3) - enabled |
| Fbt.0 | Front Button Tare (button1) - disabled |
| Fbt.1 | Front Button Tare (button1) - enabled |
| FL.H.A | In-Flight High alarm - Automatic in-flight value. |
| FL.Hi | In-Flight High alarm - manual in-flight value. |
| FL.L.A | In-Flight Low alarm - Automatic in-flight value. |
| FL.Lo | In-Flight Low alarm - manual in-flight value. |
| FLgt | Flight correction. Allows you to set an in-flight amount to compensate for falling material which will add to your container weight, after you shut off feed to the container being filled. |
| Fr.in | Frequency In. Used for rate meter scaling. |
| gATE | Contact closure - Timer Gate |
| Gros | Gross value, show on display |
| HH.NN | Timer mode: counts in hours and minutes HH:MM. |
| Hi | High Alarm The alarm state will occur if the measured value exceeds the setpoint value. |
| H.N.S | Timer mode: hours minutes and seconds HH:MM:SS |
| Hold | Contact closure mode is Hold (freeze) display and outputs. |
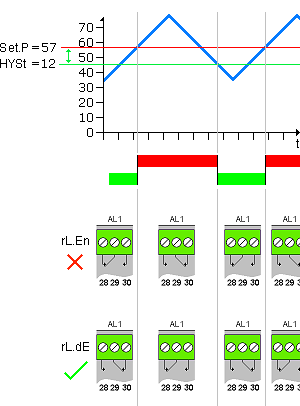
| HYSt | Hysteresis. Sets a numeric amount by which the signal must return into a non-alarm zone, before the alarm output will reset. Helps to prevent relay chatter. |
| i.o.r. | Input Over Range. The positive signal being sent to the input terminals is larger than the meter can accept. |
| i.u.r. | Input Under Range. The negative signal being sent to the input terminals is larger than the meter can accept. |
| In.__ | Lineariser Input signal level identifier. From In.01 to In.32 |
| In.b | In Band alarm. Will cause the alarm relay to trip if the measurement falls within upper and lower band limits. |
| InHi | In High. Lets you define the highest value of an input signal range. |
| InLo | In Low. Lets you define the lowest value of an input signal range. |
| L.cEL | Load Cell |
| L.d._1 | Last digit will count/increment by 1 least significant digit. Example 128, 129, 130, 131 etc. |
| L.d._2 | Last digit will count/increment by 2 least significant digits. Example 128, 130, 132, 134 etc. |
| L.d._5 | Last digit will count/increment by 5 least significant digits. Example 125, 130, 135, 140 etc. |
| L.d.10 | Last digit will count/increment by 10 least significant digits. Example 120, 130, 140, 150 etc. |
| L.d.20 | Last digit will count/increment by 20 least significant digits. Example 120, 140, 160, 180 etc. |
| L.d.50 | Last digit will count/increment by 50 least significant digits. Example 100, 150, 200, 250 etc. |
| LAt.H | Latching Ligh alarm |
| LAt.L | Latching Low alarm |
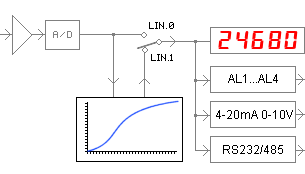
| Lin.0 | Lineariser is switched OFF. This is a user defined set of between 3 and 31 calibration points, to compensate for sensor or system non-linearity. |
| Lin.1 | Lineariser is switched ON. This is a user defined set of between 3 and 31 calibration points, to compensate for sensor or system non-linearity. |
| Lo | Low Alarm The alarm state will occur if the measured value goes below the setpoint value. |
| LoAd | Load a starting amount to a timer which tyou are installing, which should already show an accumulated amount. For example, days since last accident. |
| n.OPt | No Option fitted |
| NEg.n | Negative timing not enabled. A down counter will stop at 0. |
| NEg.y | Negative timing is enabled. A down counter will continue past 0 to show negative numbers. |
| NEtt | Nett value, show by default. |
| NN.SS | Timer mode: counts in minutes and seconds MM:SS. |
| NonE | Contact closure mode is None |
| nr.__ | Month. Used when setting the calendar. Now it is month 07 |
| Nr.__ | Number of lineariser steps you would like to reserve. |
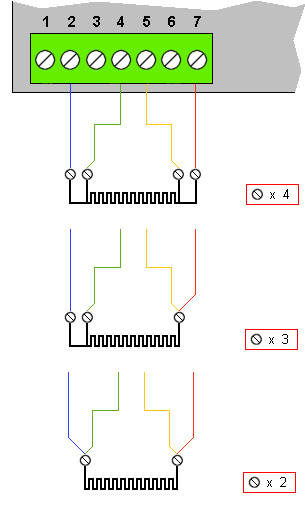
| nr._1 | Number of load cells connected in parallel = 1 |
| nr._2 | Number of load cells connected in parallel = 2 |
| nr._3 | Number of load cells connected in parallel = 3 |
| nr._4 | Number of load cells connected in parallel = 4 |
| nr._5 | Number of load cells connected in parallel = 5 |
| nr._6 | Number of load cells connected in parallel = 6 |
| nr._7 | Number of load cells connected in parallel = 7 |
| nr._8 | Number of load cells connected in parallel = 8 |
| nr._9 | Number of load cells connected in parallel = 9 |
| nr.10 | Number of load cells connected in parallel = 10 |
| NuLt | Multiplication This is the Scale factor choice. For example, if the scale factor is 3 and you chose MULt, all readings will be multiplied by 3 |
| -OC- | Open circuit It appears that your sensor connection has an open circuit fault. |
| OC._0 | Open Circuit sensor will cause the measured value to be at 0. |
| OC._H | Open Circuit sensor will cause the measured value to be at the HIGH end of the scale. |
| OC._L | Open Circuit sensor will cause the measured value to be at the LOW end of the scale. |
| Of.St | Offset A fixed numeric offset, which can be negative or positive, which can be applied to your meter's readings at any time. It is useful in such applications as weighing, if structures have been added to or removed from a weighing platform. You can compensate fr these changes directly with the offset feature. |
| OFF | Alarm channel disabled. |
| Off | Contact closure mode is Off |
| Off | No daylight saving compensation. Used for clocks always showing GMT, Zulu, or in regions where daylight saving is not used. |
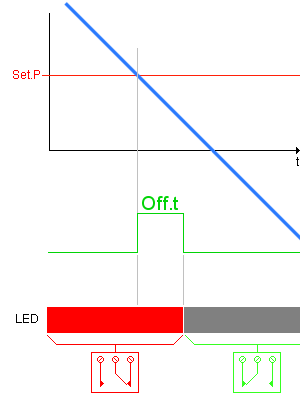
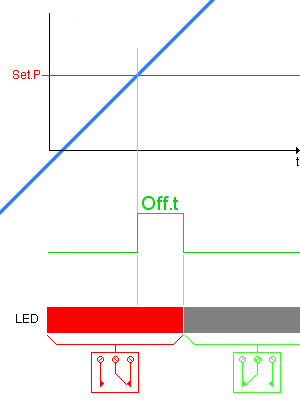
| OFF.t | Off-trip delay. Seconds before an alarm will reset, if the measurment is out of alarm state for the whole period. |
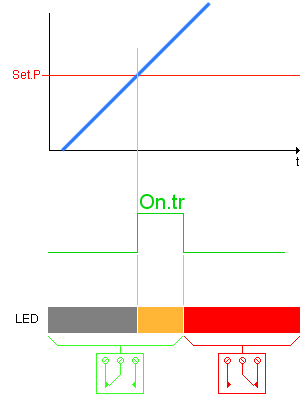
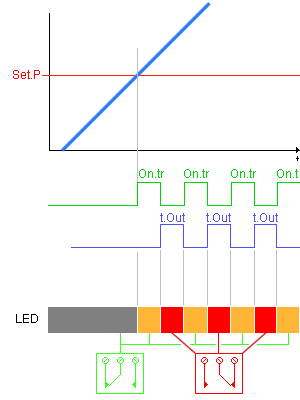
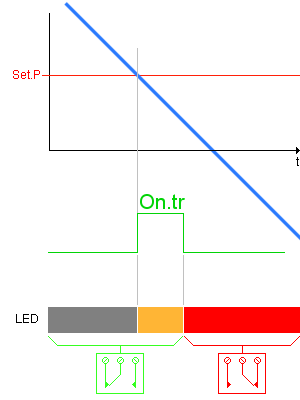
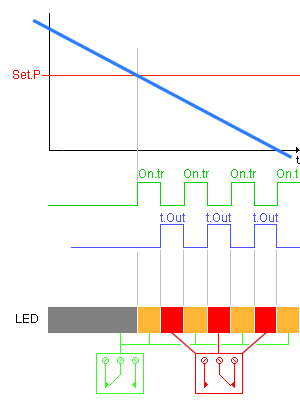
| On.tr | On-trip delay. Seconds before an alarm will activate, if the measurment is in alarm state for the whole period. |
| -Or- | Display Over Range. The positive number being sent to the display has more digits than the display. |
| Out.b | Out Band alarm. Will cause the alarm relay to trip if the measurement falls outside upper and lower band limits. |
| Out.H | Output High. Lets you define the highest value of an output signal range |
| Out.L | Output Low. Lets you define the lowest value of an output signal range. |
| P.Frq | Power Frequency - an optional installed feature to show precision frequency of the meter's AC power. |
| P.in | Pulses In. Used for counter/totaliser scaling. |
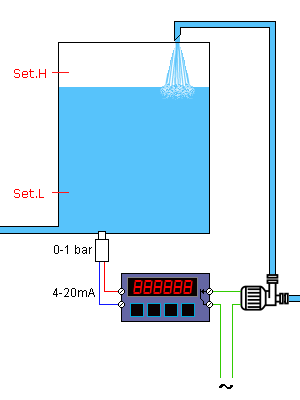
| PC.Hi | Pump Control - High Used to control a pump which is filling a container or reservoir. |
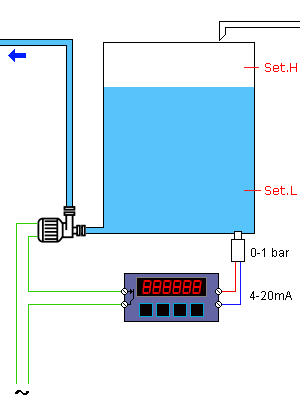
| PC.Lo | Pump Control - Low Used to control a pump which is emptying a container or reservoir. |
| PEA.g | Peak Gross value, show on display |
| PEA.n | Peak Nett value, show on display |
| Pot | Potentiometer Input. 3 wire or 4 wire. |
| Pr.C1 | Protocol C1 Simple ASCII Continuous stream |
| Pr.H1 | Protocol H1 LEL GPS receiver protocol |
| Pr.P1 | Protocol P1 Simple ASCII addressed protocol |
| Pr.P2 | Protocol P2 Modbus ASCII addressed protocol |
| Pr.P3 | Protocol P3 Modbus RTU addressed protocol |
| Prnt | Contact closure- cause a print stream to be sent from serial port. |
| PrSt | Pre-set a count amount |
| Pt.01 | Lineariser confirmation of which point your about to define, with In.01 and rd.01 |
| Pt.31 | Lineariser confirmation of which point your about to define, with In.31 and rd.31 |
| Pul.H | Pulsed High alarm. Gives one pulse of alarm relay, for a defined duration, when measurement exceeds setpoint. |
| Pul.L | Pulsed Low alarm. Gives one pulse of alarm relay, for a defined duration, when measurement falls below setpoint. |
| quit | Quit your settings without saving |
| r.toP | The maximum resistance you want to measure, in resistance mode. |
| rAtE | Rate |
| rd.__ | Lineariser Reading level identifier. From rd.01 to rd.32 |
| rdHi | Reading High. Lets you define the highest value of a display range. |
| rdLo | Reading Low. Lets you define the lowest value of a display range. |
| rES | Resistance input, 2, 3 or 4 wire. |
| rEv.0 | Reverse / Mirrored display for heads-up application is Off. |
| rEv.1 | Reverse / Mirrored display for heads-up application is On. |
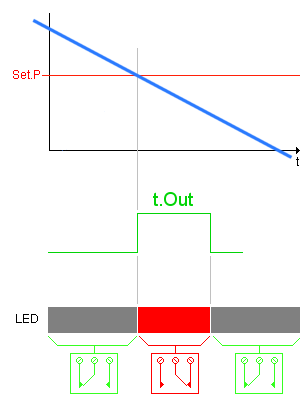
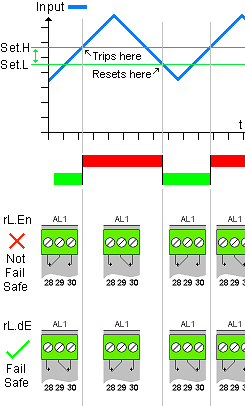
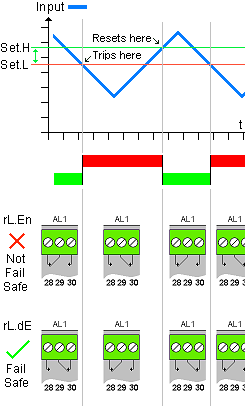
| rL.dE | Relay will de-energise on alarm (failsafe) |
| rL.En | Relay will energise on alarm (not failsafe) |
| rPt | Repetition rate You can set how often a stream of data is sent out, when in mode C1 |
| rSt_ | Contact closure mode is Reset counts and any latched or peak / valley stored values. |
| rSt.n | Reset - No? |
| rSt.Y | Reset - Yes? |
| rtd.A | RTD type A Accepts PT100 input, 2, 3 or 4 wire |
| rtd.B | RTD type B Accepts PT100 input, 2, 3 or 4 wire |
| SAUE | Save your settings |
| -SC- | Short circuit It appears that your sensor connection has a short circuit fault. |
| Sc.__ | Start Character You can set a HEX start character for a data stream. For example 02=STX |
| SCAL | Scale A multiplying or dividing scale factor which can be applied to the meter's final reading, after normal scaling has been done. Allows easy conversaion of reading from kg to pounds, litres to gallons or pints, etc. |
| SEnS | Sensitivity of your load cell, expressed as mV/V |
| SEr | Serial data input function |
| SEt.H | Upper setpoint. Used in Band-mode or Pump-Control alarms. |
| SEt.L | Lower setpoint. Used in Band-mode or Pump-Control alarms. |
| SEt.P | Set point The point at which an alarm relay output will change state. |
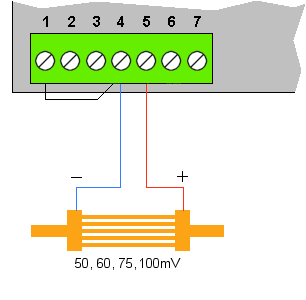
| SHnt | Shunt input Accepts 0-50mV, 0-60mV, 0-75mV or 0-100mV DC current shunt signal. |
| SSS.t | Timer mode: counts in seconds to 1/10 second resolution. |
| SSSS | Timer mode: counts in whole seconds. |
| StoP | Stop |
| Strt | Start |
| t.___ | Bin time Sets the duration the counting bins are open for. |
| t.cAP | Total capacity of your weighing system |
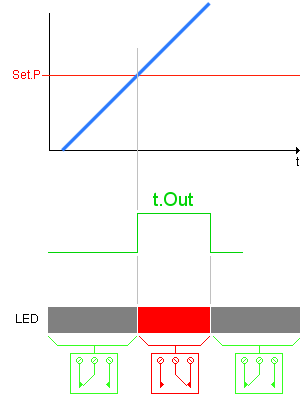
| t.out | Timeout of alarm relay |
| t.rSt | Contact closure - Timer Reset |
| t.Stp | Contact closure - Timer Stop |
| t.Stt | Contact closure - Timer Start |
| tArE | Tare value, show on display |
| tc_b | Thermocouple, Type B |
| tc_E | Thermocouple, Type E |
| tc_J | Thermocouple, Type J |
| tc_K | Thermocouple, Type K |
| tc_n | Thermocouple, Type N |
| tc_r | Thermocouple, Type R |
| tc_s | Thermocouple, Type S |
| tc_t | Thermocouple, Type T |
| thEo | Theoretical calibration. You must enter expected signal levels and desired display values. |
| tot | Totaliser function |
| tYPE | Input Signal Type Use up or down button to choose an input signal type. |
| UnAv | Feature is unavailable |
| UP | Counter mode = Up (total increases) |
| -Ur- | Display Under Range. The negative number being sent to the display has more digits than the display. |
| US | United States daylight saving calendar. |
| VAL.g | Valley Gross value, show on display |
| VAL.n | Valley Nett value, show on display |
| Yr.__ | Year. Used when setting the calendar. Now it is year 2026 |
| Manuals / Handbooks | |||
| Document | Valid from | Valid to | Changes |
| Current Version 1 | 5 April 2021 | Current | First Release |
| Manual Version 1 | 5 April 2021 | Current | First Release |
| Main Firmware | |||
| Firmware | Valid from | Valid to | Changes |
| Firmware F0.03 B.007 | 5 April 2021 | Current | First Release |
| Main Circuit Board | |||
| Hardware | Valid from | Valid to | Changes |
| 9129-0270 P5 | 5 April 2021 | Current | First Release |
| Display Circuit Board | |||
| Hardware | Valid from | Valid to | Changes |
| 9129-0170 P3 | 5 April 2021 | Current | First Release |
| Analogue Input Circuit Board | |||
| Hardware | Valid from | Valid to | Changes |
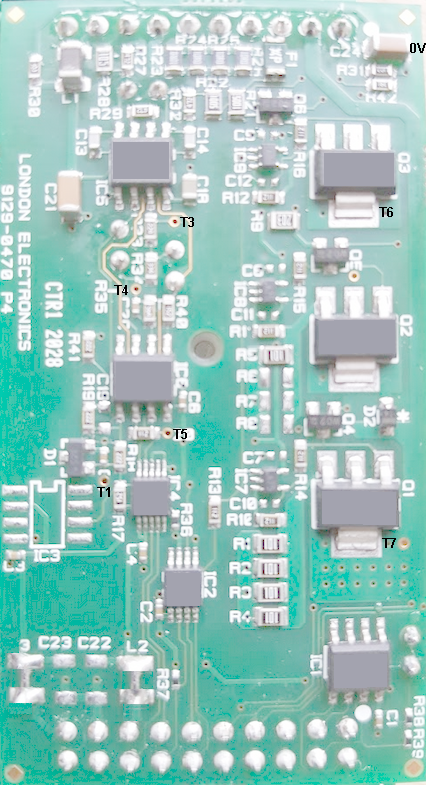
| 9129-0470 P4 | 5 April 2021 | Current | First Release |
| Real Time Clock Circuit Board | |||
| Hardware | Valid from | Valid to | Changes |
| 9129-0870 P3 | 5 April 2021 | Current | First Release |
| Upper Option Carrier Circuit Board | |||
| Hardware | Valid from | Valid to | Changes |
| 9129-0370 P3 | 5 April 2021 | Current | First Release |
| Analogue Output Circuit Board | |||
| Hardware | Valid from | Valid to | Changes |
| 9129-0570 P2 | 5 April 2021 | Current | First Release |
| Data Output Circuit Board | |||
| Hardware | Valid from | Valid to | Changes |
| 9129-0670 P4 | 5 April 2021 | Current | First Release |