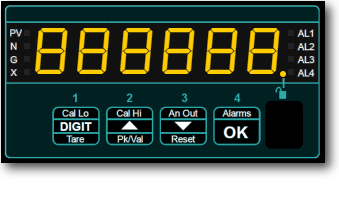
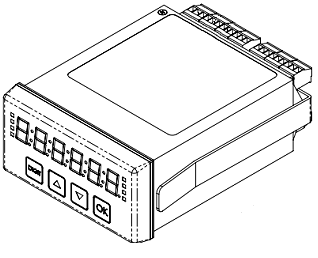
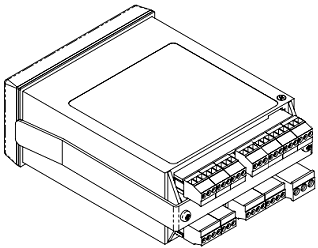
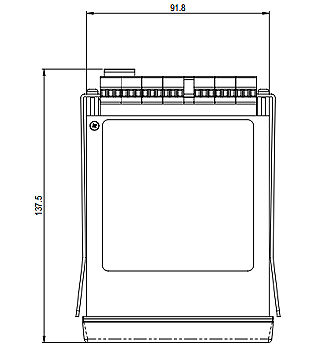
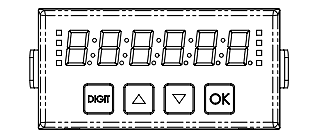
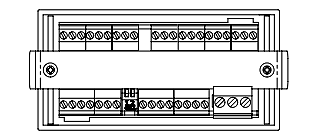
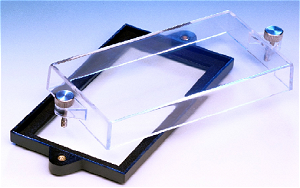
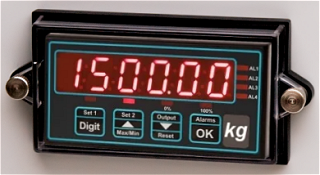
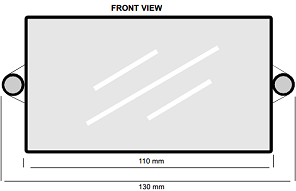
front panel

Use buttons
above to
select the
next page.


The new standard for digital panel meters

INT5: Universal Digital Panel Meter

print

The new  INT5  digital panel meter is easy to use and works with most common sensors.

This multi-language manual works on desktop and most phones, with short, compact videos to demonstrate many of the settings. Perfect for engineers on site and in the office!

3 colour high contrast LED display with adjustable brightness.


32 bit MCU for high performance
  • Simple
  • Accurate
  • Easy to use
  • Versatile
  • Reliable
  • UK Designed
  • UK Made
  • 3 year warranty
  • Latest version
  • 20 year evolution
UK designed and builtDesigned, developed and built in the UK


General Description
Multi-sensor / multi-function capability
Unique user-manual design for easy setup
A high performance digital panel meter:  1/8 DIN
6 digits, LED, 3 colours
10 brightness levels.
Self-locking if unattended.
Sealed IP65 from the front, IP67 option
Panel cutout 45mm high x 92mm wide
Depth behind panel = 125mm

Standard Input Signals:
A versatile, precise and easy to use panel meter!

Optional Input signals:

Optional Output signals:
You can easily add output modules to your  INT5  meter at any time. Plug in an option when you need a new feature.

They are easy to configure, have high precision and resolution and are galvanically isolted.
Power voltage options
11-30V DC or 95-265V AC

Real-time diagnostics
If there is an unexpected change in your sensor wiring or signal level, the meter will let you know, with a description of the type of change, to help you easily solve issues on site.

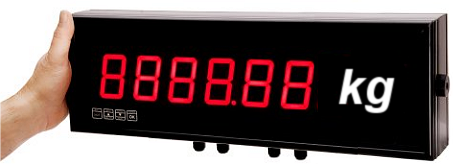
Large digit versions for long distance viewing
We offer all these market-leading benefits in our  Fusion5  series of large digital displays also.


Fusion5 large digit multi function display with red green and yellow display


Use them outside, inside, in harsh environments, with 3 colour displays as standard.

Digit heights: 60mm, 100mm, 150mm, 200mm, 300mm and 400mm for clear viewing up to 200m away.


Multi-lingual:
This manual is available in several languages.

Video examples:
Quickly become an expert user - many settings have a short, clear video demonstration.

The videos are silent, so you can use them in noisy environments when working on site.

Specifications
Everything you need to know is easy to find.

We put your needs first!


Warranty: 3 years
Latest Software = F0.03 Build-13: 24 June 2021

London Electronics Ltd

Thorncote Road
Thorncote Green
Near Sandy
Bedfordshire
SG19 1PU
England

☎  +44 (1767) 626444


Web https://www.london-electronics.com


Email sales@london-electronics.com


We are here to help you!

We can help you!

Your question or comment


Your name


Your email address


Our privacy statement
Form Index: 1


Warnings

print

Read this manual and all warnings before you install the meter.

Warning Icon

Install the meter ONLY when you are sure that you can satisfy all requirements.

Check that the model number and supply voltage suit your application.

Hazard Icon

Connect the meter according to current IEE regulations, IEC61010 & NFPA:70 National Electric Code in USA.

This meter is for Installation class II service only. It has exposed electrical and power terminals. You must install it in a suitable enclosure which will protect users from electric shock.

We designed this meter to be used in Pollution-Degree 2 environments only.

Power supplies to this equipment must have anti-surge (T) fuses rated according to the specifications in the power supply section of this manual.

A switch or circuit breaker, clearly marked as a disconnecting device, must be installed close to the installation.

Do not touch any circuitry after you have connected the meter, because there may be lethal voltages on the circuit board.

Only adjust switches or connections on the meter when the power is turned off.

Tighten all screw terminals before you switch the meter on.

Warning Icon

Only clean the meter front panel with a soft damp cloth. Only lightly dampen with water. Do not use any other solvents.

You can clean the rear case with a dry cloth only; use no liquid or solvent on it.

If in doubt:
Ask someone who is QUALIFIED to help.
Do not assume anything. Always double check.


We are here to help you!

We can help you!

Your question or comment


Your name


Your email address


Our privacy statement
Form Index: 2


Connections

print

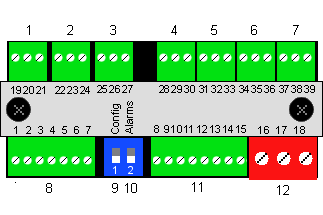
See the individual mode, power and output pages for details of terminals for each input signal type.

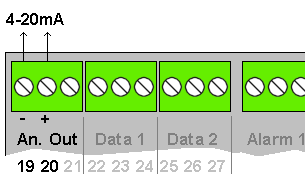
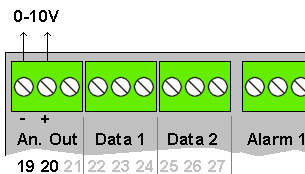
Plug-in Connector Functions, Top Row:
1. Analogue output - option
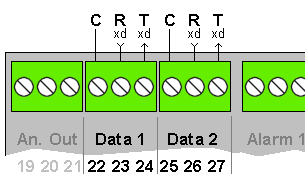
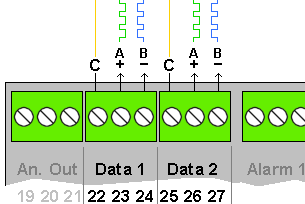
2. Data Port 1 - option
3. Data Port 2 - option
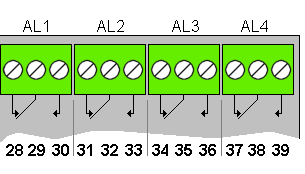
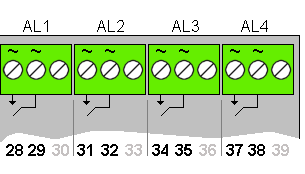
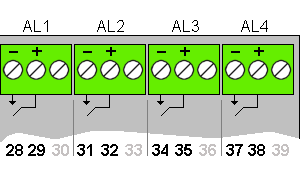
4. Alarm Relay 1 - option
5. Alarm Relay 2 - option
6. Alarm Relay 3 - option
7. Alarm Relay 4 - option
Rear connectors for digital panel meter
Plug-in Connector Functions, Bottom Row:
8. Analogue signal Inputs
9. Lock switch - main configuration
10. Lock switch - alarm configuration
11. Contact closure / NPN Logic and pulse signal inputs
12. Power supply input

Specifications: Plug-in Screw Terminal Connectors
FunctionA label on the mounting bracket near each connector identifies the terminal numbers.
Power1 x Plug-In 3 pin colour coded connector.

Red : 95-265VAC power
Black : 11-30V DC power

Cable exits below the connector on bottom row.

Use 3.2mm flat blade terminal screw driver
Signal/ControlPlug-In Green connector
Cable exits below connector on bottom row
Cable exits above the connector on top row

Use 2.4mm flat blade terminal screw driver


We are here to help you!

We can help you!

Your question or comment


Your name


Your email address


Our privacy statement
Form Index: 3


Power Connection and Fusing

print

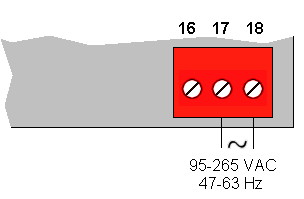
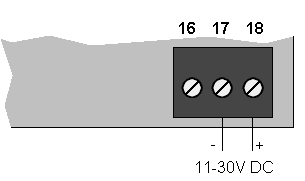
The meter can accept either 11-30V DC or 95-265V AC. You MUST connect the correct power voltage or you will damage the meter.

See the rating label on the top surface of the meter for its Power Voltage.

The colour of the power connector identifies the voltage range your meter can accept.

AC Power - Red Connector
Digital panel meter AC Power connector


DC Power - Black Connector
Digital panel meter DC Power connector


Specifications: Power Supply
AC Version95-265 V AC 47-63 Hz 8W max.
Fuse with 2A 'T' rated (anti-surge) fuse.
Power Connector = Red
Switch-mode transformer galvanic isolation
DC Version 11-30V DC 8W max.
Fuse with 5A 'T' rated (anti-surge) fuse.
Power Connector = Black
Switch-mode transformer galvanic isolation

NB: Current Limiting
If your DC power has current limiting less than 2A, per meter being supplied, the voltage may fail to rise above 10V when you switch on, so the meter may not start.

This is caused by the initial surge current, when the internal capacitors charge up.

Ensure your power supply can provide at least 2A peak current, per meter.


We are here to help you!

We can help you!

Your question or comment


Your name


Your email address


Our privacy statement
Form Index: 4


Ordering Codes

print

Create an ordering code from the features you want ...

Meter FamilyINT5
Accepts Load Cell, 4-20mA, 0-10V, Thermocouples, PT100, Potentiometer, Pulse counter, Rate/rpm, Elapsed timer, mV DC shunt, Resistance

Optional functions are available to add precision Power Frequency measurement and a Real-Time Clock for Time, date and day counting applications.


Your ordering code is

INT5-0-0-0-0-AC-0-0-0


UK List price is GB Pounds 0.00


The factory MRP code is:

????-????


We are here to help you!

We can help you!

Your question or comment


Your name


Your email address


Our privacy statement
Form Index: 5


Locking & Editing settings

print


There are 2 Unlocked 'edit' modes.

Ed.AL: Edit Alarm settings:
In normal running mode, press 'OK' button for 5 seconds until display shows 'Ed.AL'.

You can now edit alarm modes and setpoints.

Ed.CF: Edit Config settings (Full Access):
In normal running mode, press 'OK' button for 10 seconds until display shows 'Ed.CF'. Do not release the button when you see Ed.AL

You can now edit all paremeters and modes in the meter.

How to Lock your meter:
When you switch your meter on, it will be locked automatically.

After you have unlocked it, it will lock itself automatically if you make no changes within 5 minutes.

To lock it quickly, switch the meter off for 5 seconds and then switch on again.


Look at the LED near the unlock symbol on the meter.

All Instrument configuration settings unlocked
Indicator Lock Icon lit 3.8 seconds, off 0.2 second

digital panel meter front lens
8
8
8
8
8
8


Look at the LED near the unlock symbol on the meter.

Alarm settings only unlocked
Indicator Lock Icon lit 0.2 seconds, off 3.8 seconds

digital panel meter front lens
8
8
8
8
8
8


Look at the LED near the unlock symbol on the meter.

Fully Locked
Indicator Lock Icon  is unlit at all times

digital panel meter front lens
8
8
8
8
8
8


We are here to help you!

We can help you!

Your question or comment


Your name


Your email address


Our privacy statement
Form Index: 6


Colour setting

print

You can set the normal display colour to be Red, Yellow or Green.

1. Unlock the configuration menu

2. Press and hold buttons 3 and 4 together for at least 3 seconds.


The display will say:

coL.G = Green
coL.Y = Yellow
coL.r = Red

3. Press the △ or ▽ button to set the colour you want.

digital panel meter front lens
C
O
L
g

Press the △ or ▽ button ...

digital panel meter front lens
C
O
L
y

Press the △ or ▽ button ...

digital panel meter front lens
C
O
L
r


4. Press OK to save your choice.

Colour Change in Alarm condition
The display can change colour when it is in an alarm state. See the example below.

See how to adjust it in the Alarm setting section of the manual.


Colour during Configuration
During most configuration procedures, the display colour will be Yellow.


further information This video demonstrates how to change the colour of the display.

Unlock the configuration menu first..

Quick and Easy


Brightness Adjustment

The display has 10 levels of brighteness. You can change the brightness at any time during normal operation, when the meter is locked.

1. Press button 2 for at least 3 seconds.

The display will say  bri.X 
X is the brightness value from 0 (dimmest) to 9 (brightest)

2. Press the △ or ▽ button to change the brightness level.

3. To save your choice, press button :  OK .

digital panel meter front lens
b
r
i
7


further information This video shows you how to change the brightness of the display.

Lock the configuration menu first.

Quick and Easy


We are here to help you!

We can help you!

Your question or comment


Your name


Your email address


Our privacy statement
Form Index: 7


Front Panel Buttons

print

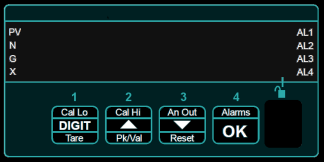
Each button has several functions. They are normally locked when the meter is being used, to prevent unwanted changes to the configuration.

See [ How to Unlock / Lock the meter ]


The buttons offer these useful functions while the meter is locked:

Button 1 :
Can be enabled as a tare or zeroing button. Set Fbt.1 *
Can be disabled to have no function Set Fbt.0 *

Button 2 :
Press briefly and repeatedly on button 2 to see Peak (maximum memory, PV LED is Yellow) and Valley (minimum memory, PV LED is Green) stored values and the live value.
Press for more than 3 seconds to adjust the display brightness.

If you want the display to give a live update of the peak value (peak tracking) you should use a contact closure input, configured for peak display. While the contact is closed, the display will track the input and automatically update with new peak values as they happen.

Can similarly be enabled for valley values.
The maximum update rate is 10 readings per second.


Button 3 :
Can be enabled as a Reset button.
Press it for more than 3 seconds to reset any tare or peak or valley memories. Set Fbr.1 *
It can be disabled: Set Fbr.0 *

Button 4 :
Brief presses on button 4 let you view the alarm setpoints for each of the 4 alarms, if used.


*
How to access Fbt.X (Front button Tare) and Fbr.X (Front button Reset) to enable or disable taring and reseting on the front panel.

Calibration lock switch C must be OFF

Press buttons 3 and 4 together for 3 seconds to see
"diSP"


Press button 4 repeatedly until you see
"Fbr.0" (reset disabled on button 3) or
"Fbr.1" (reset enabled on button 3)

You can change the settings with button 2 or Button 3

Press "OK" to save your choice.

Now you see :
"Fbt.0" (Tare disabled on button 1) or
"Fbt.1" (Tare enabled on button 1)

You can change the settings with button 2 or Button 3

Press "OK" to save your choice.


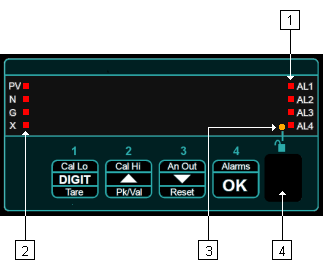
Indicator LEDs

Your display has indicator LEDs which give status information during set-up and operation.

digital panel meter annunciators


[1]
Alarm Indicators


In normal operation, these LEDs will be unlit.

If an alarm channel goes into an alarm state, its LED will light.

When you configure an alarm channel, its light will blink yellow, to show which channel you are adjusting.


[2]
Value Indicators


PV lit, means the value on the display is either the Peak (PV LED is Yellow) or Valley (PV LED is Green)

N lit means the value on the display is a Nett value

G lit means the value on the display is a Gross value

X lit means there may be a problem with the sensor or its wiring. See the Input type pages for details


[3]
Lock Indicator


When your meter is fully locked, this LED will not be lit.

This indicator will blink to identify which features are unlocked.

See [ How to Unlock / Lock the meter ].


[4]
Units of Measure Window


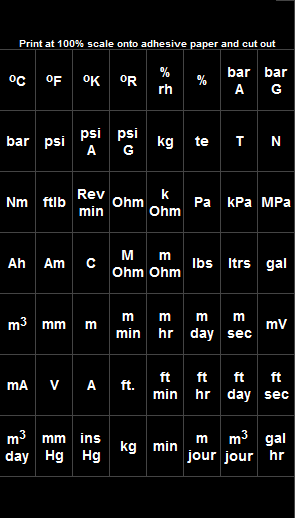
You can place a label behind this protective window to show what units your meter is measuring, for example kg, Bar, Deg.C etc.

See the Units Of Measure page for details.


We are here to help you!

We can help you!

Your question or comment


Your name


Your email address


Our privacy statement
Form Index: 8


Type Selection

print

The INT5 can accept many different industrial sensor types. They are very easy to select.

1. Unlock the configuration menu

2. Press and hold buttons 1 and 2 together for at least 6 seconds.

The display will show...

digital panel meter front lens
t
y
p
e


3. Press the △ or ▽ button repeatedly until you see the meter type you want.

The available meter types are:-

L.cEL Load Cell meter
4-20 4-20mA meter
10 v 0-10V meter
tot Pulse input Totaliser
rAtE Pulse input RPM/Rate meter
tc b Thermocouple type B
tc E Thermocouple type E
tc J Thermocouple type J
tc K Thermocouple type K
tc n Thermocouple type N
tc r Thermocouple type R
tc S Thermocouple type S
tc t Thermocouple type T
rtd.A PT100 / RTD
rtd.b PT1000 / RTD
rES Resistance meter 4 wire
Pot 3 wire Potentiometer
Shnt DC mV Shunt meter
ElAP Elapsed Timer function

You can install option modules in your meter, to get these extra types:

88:88 Clock function
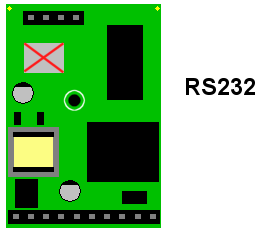
232 RS232 slave input display
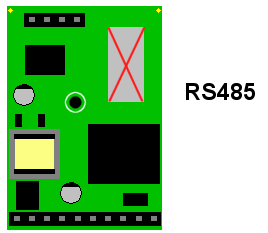
485 RS485 slave input display
P.FrE Power Freq. 47.000 to 63.000 Hz.


4. Press OK to save.


We are here to help you!

We can help you!

Your question or comment


Your name


Your email address


Our privacy statement
Form Index: 9


Load Cell input mode

print

Load Cell mode is ideal for all weighing, torque, strain and force measurements.

It is easy to calibrate and has many useful features.

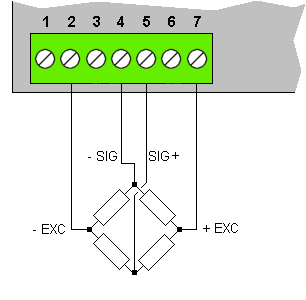
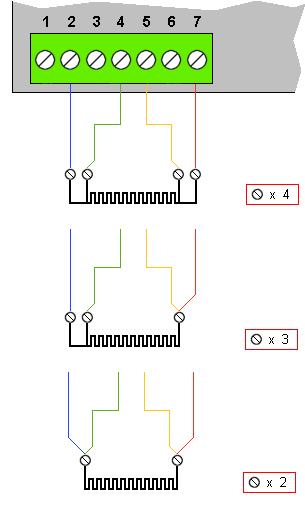
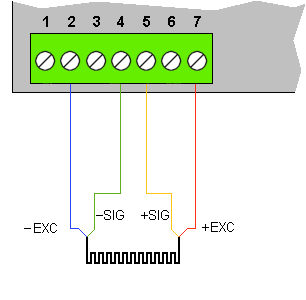
You only need a 4-wire connection for high performance cable resistance compensation, thanks to our new patented signal processor.

digital panel meter load cell connection
You can connect up to 4 x 350 Ohm or 8 x 700 Ohm load cells in parallel.

The meter constantly checks your system resistance to give you early warning of any unexpected changes caused by moisture in junction boxes, corroded connections etc.

If your cells are in a hazardous area, you only need to use 4 x Zener Barriers with this meter, where most other meters would need 6 barriers.

How to choose sensor type:  L.cEL

Unlock the calibration menu, set Ed.CF

1. Press buttons 1 and 2 together for at least 6 seconds.

The display will say:

      typE

2. Press the △ or ▽ button repeatedly until you see:

     L.cEL

3. Press  OK

You only need to do this procedure when you first install your meter or when you want to change the meter's sensor type.


digital panel meter front lens
L
c
E
L
kg


Unique Feature: This meter will automatically compensate for changes in cable resistance with a 4 wire connection. Most other meters need a 6 wire connection. You can also use it with passive zener barriers, in a 4 wire system.

How to choose a Calibration Method:

Direct Calibration is recommended, because it calibrates the whole system including thedisplay and the load cells and any leverage effects. You will put a known calibration weight on the platform and adjust the meter to read that weight exactly.

Theoretical Calibration is only recommended if you cannot apply a test weight to your system. You will enter details from the load cell calibration certificate.


Selection Method:
Unlock the calibration menu, select Ed.CF

Press button 1 and button 2 at the same time, for 3 seconds.

The display will briefly show  C.SrC (Calibration source).

It will then show either ...

Direct  dir.
or
Theoretical  thEo..

Press button 2 or button 3 to choose the calibration type you want.

Press  OK to save your choice.

Quick and Easy


Direct Calibration (Recommended)

Choose direct calibration if you will put known calibration weights on the system to calibrate the display. We recommend this calibration mode, because it allows you to calibrate your whole weighing system in one procedure.

Unlock the calibration menu, select Ed.CF

Press Button 1 for three seconds.
You should see  dir.
You may see  Theo.
If so, go back and select  dir

You will see  In.Lo. Apply the lowest load value, usually 0kg

To save your choice, press  OK

Then you will see  rd.Lo. Adjust the display to its desired reading for this load.

To save your choice, press  OK


Press Button 2 for three seconds.
You will see  In.Hi.
Apply the highest load value, ideally 100% of full load.

To save your choice, press  OK

You can calibrate with less load, with proportionally less accuracy.

You will see  rd.Hi.
Adjust the display to its desired reading for this load

To save your choice, press  OK

That completes the Direct Calibration.

We suggest that you check 0% load and some intermediate loads, to ensure your system is working as you wish.

This video shows how to calibrate with a known weight (direct calibration).

In this example, we start with an empty load cell platform and set the display to show 0.000.

We then put a known 5.000 kg weight on the load cell platform and adjust the display to show 5.000 kg.


Quick and Easy


How to change Decimal Point Position
It is easy to change the decimal point position during your calibration. In the example above, we calibrated for 0.000 to 5.000 kg.

Let us say we want to calibrate 0.00 to 5.00 kg...

During the stage where we adjust the high load reading, we can press button 2 for three seconds while we edit the value.

All decimal points will illuminate, with one decimal point brighter than the others.

Press Button 2 or Button 3 to change the position of the brightest decimal point.

Press OK when the brightest decimal point is where you want it.

You will see the decimal point is now in the new chosen position.

You can then continue to edit the numeric value as you wish.

further information This video demonstrates how to change the decimal point position.

Quick and Easy


rd.Hi.
Theoretical Calibration
Choose theoretical calibration if you will enter details from the load cell calibration certificate into the meter.

You do not need to connect the load cell to the meter for this calibration method.

This method is less accurate than the direct calibration method, because it does not include all the components of the weighing system.


Load Cell Model: LCC25
Certificate of Calibration
 Capacity:2500 kg
 Sensitivity:2.156mV/V
 Resistance:354 Ohms
 Excitation:5-12V
 Tested by:signature
Sat 21st Sep 2024


Enter the following values into the meter ...

1.  Sens . This is the sensitivity of the load cell in  mV/V 

digital panel meter front lens
5
E
n
5
kg


Enter mV/V as 2.156


2.  Res. This is the resistance of the load cell in  Ohms 

digital panel meter front lens
r
E
5
kg


Enter load cell resistance in ohms as 354


3.  Nr.. This is the number of load cells connected in parallel

digital panel meter front lens
n
r
kg


Enter number of cells in parallel. eg 3


4.  t.CAP. This is the total capacity of the system, as you want it to appear on the display. You can also set the decimal point position during this stage, using the method described earlier.

digital panel meter front lens
t
C
A
P
kg


further information This video demonstrates how to calibrate without an input signal (theoretical calibration).

We will use the example calibration sheet above, with 3 x load cells which are 2.156mV/V, each with 2500kg capacity (total capacity 7500 kg). Load cells are 354 Ohms, measured between the excitation terminals.

The -540kg result is because we have a previous 540kg tare value already stored in the meter.

Quick and Easy


Permanent Display value...


How to stabilise your reading if the signal is varying due to vibration, electrical interference etc.


After basic direct or theoretical calibration, you can easily linearise your weighing system if its errors are repeatable.


How to change the display resolution: Count by 1,2,5,10,20 or 50


Display hold, Tare, Reset, Show Peak, Show Valley, Show Nett, Gross, Heads-Up format ...


How to offset the display


How to re-scale for different units without re-calibrating


Automatic drift cancelling


Specifications

Excitation PowerSmart constant current (patented) cable resistance compensation.

Generates a nominal 8V excitation at initial installation calibration and maintains a constant voltage across the cells as cable resistance varies.

120mA current capacity.

Will warn you if your cabling resistance changes with a flashing "X icon".

The meter remains precise for a change in cable resistance of up to 10% of the total combined installation resistance.

Examples:
No errors even with 80 Ohms cable resistance change with a single 700 Ohm cell and 100 Ohms cabling resistance, or 10 Ohms cable change with 4 x 350 Ohms in parallel and 20 Ohms cabling resistance.

It reports open circuit or short circuit conditions.
Accuracy+/- 0.025% of range
Temperature coefficient+/- 25ppm/Deg C
Auto zeroConfigurable threshold level and duration.
LinearisationSelectable 3 to 32 calibration points. Function can be switched in and out. Separate from basic system calibration.
Filtering / Averaging4 pole active low pass filter, 7Hz cutoff.

Additional user adjustable ramp time for a step change of 0.0 to 99.9 Seconds
Update RateDisplay updates 10 times per second
Count-by roundingCan be user adjusted to count in increments of 1, 2, 5, 10, 20, 50
Dead-load add / subtractFully adjustable to compensate for added or removed hardware.
Independent scale factorFully adjustable multiplying or dividing scale factor, which does not affect the basic calibration.

Ideal for converting a scale from pounds to kilos, or bushels or ounces etc.


System Diagnostics

Diagnostics

If something is wrong with your measurement system, we will tell you about it with these messages:

i.u.r. 
Input Under Range. This means the input signal is very low, below the normal low signal level we would normally expect for the chosen signal type.

i.o.r. 
Input Over Range. This means the input signal is very high, above the normal high signal level we would normally expect for the chosen signal type.

d.u.r. 
Display Under Range. This means the display does not have enough digits to show the very low value being measured. Example, trying to display less than -199999 on a 6 digit display.

d.o.r. 
Display Over Range. This means the display does not have enough digits to show the very high value being measured. Example, trying to display more than 999999 on a 6 digit display.

-SC- 
Short Circuit. This means we have detected a Short Circuit in your sensor wiring.

-OC- 
Open Circuit. This means we have detected an Open Circuit in your sensor wiring.

x  icon flashing red
Unexpected input wiring resistance change. There is an error or change in your sensor wiring. The cabling resistance is higher or lower than when the meter was first installed.

All decimal points flashing red, no digits
The main board has stopped communicating with the display board.


We are here to help you!

We can help you!

Your question or comment


Your name


Your email address


Our privacy statement
Form Index: 10


0-10V input mode

print

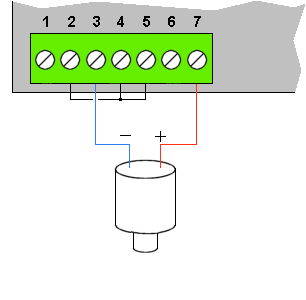
How to connect an active 0-10V signal to your meter

This example is suitable for connecting an active DC Voltage signal from a PLC or other processor or sensor.

digital panel meter 0-10V DC Input connection
The meter can accept an input range of -20 to +20V DC in this mode.

The input is electrically isolated from power and output ports


The meter is easy to calibrate and has many useful features.


How to choose sensor type:  10v

Unlock the calibration menu, set Ed.CF

1. Press buttons 1 and 2 together for at least 6 seconds.

The display will say:

      typE

2. Press the △ or ▽ button repeatedly until you see:

     10v

3. Press  OK

You only need to do this procedure when you first install your meter or when you want to change the meter's sensor type.


digital panel meter front lens
1
0
V


How to calibrate your meter

There are 2 calibration methods available:

Direct Calibration method:

Direct calibration is more accurate, because it calibrates the whole system, including the sensor.

1. Connect your sensor to the meter and to your process.

You must be able to adjust the process to two precisely known values, ideally at 0% and 100% of your measurement range, but you can use any 2 well separated points.

You will adjust the meter to read those two calibration values.

2. If the meter is locked, unlock the calibration menu

3. Press 'Cal Lo' and 'Cal Hi' together for 3 seconds until you see 'C.Src' (calibration source)

4. Press the △ or ▽ button repeatedly until you see: 'dir' then press 'OK'


Example Calibration:

Calibrate the meter with an input signal range of 1.000 V to 9.000 V, to display 0.0 to 60.0

High Calibration point:
  In.Hi = 9.000 V
  rd.Hi = 60.0

Low Calibration point:
  InLo = 1.000 V
  rd.Lo = 0.0

We will also check the middle of the range at 5V input, to verify that the display shows 30.0

Method...


High calibration point
1. Press 'Cal Hi' button for 3 seconds.

2. The display will say 'dir' to confirm you are in Direct calibration made, and will then say 'InHi'.

3. Apply the high level calibration signal 9.000V in the example, and press 'OK'

4. The display will now briefly say 'rd.Hi' to confirm you are in the High Reading setting.

5. To set decimal point position, press 'Cal Hi' button again for 3 seconds and move the decimal point to the desired position with △ or ▽ buttons. Press 'OK' to save.

6. Press 'Digit' button to select each digit and edit with the △ or ▽ buttons to show 60.0 or your desired high reading. Press 'OK' when all digits are correct.


Low calibration point
7. Press 'Cal Lo' button for 3 seconds.

8. The display will say 'dir' to confirm you are in Direct calibration made, and will then say 'InLo'.

9. Apply the low level calibration signal 1.000V in the example, and press 'OK'

10. The display will now briefly say 'rd.Lo' to confirm you are in the Low Reading setting.

11. Press 'Digit' button to select each digit and edit with the △ or ▽ buttons to show 0.0 or your desired low reading. Press 'OK' when all digits are correct.


12. Apply 50% of input range, so 5.000V in the example and ensure the display reads 50% of display range, being 30.0 in the example.

The meter will lock itself automatically within 5 minutes, or immediately, if you switch the meter off then on again.

Quick and Easy


Theoretical Calibration method:

Theoretical calibration allows you to define two input and corresponding display values, without needing to connect a sensor to the display.

It is not as accurate as Direct calibration, because we do not include the sensor in the calibration, but it is useful as an approximate calibration method.

1. If the meter is locked, unlock the calibration menu

2. Press 'Cal Lo' and 'Cal Hi' together for 3 seconds until you see 'C.Src' (calibration source)

3. Press the △ or ▽ button repeatedly until you see: 'thEo' then press 'OK'


Example Calibration:

Calibrate the meter with a theoretical input signal range of 2.000 V to 10.000 V, to display 0.0 to 75.0

High Calibration point:
  InHi = 8.750 V
  rdHi = 75.0

Low Calibration point:
  InLo = 2.000 V
  rdLo = 0.0

Method...


High calibration point
1. Press 'Cal Hi' button for 3 seconds.

2. The display will say 'theo' to confirm you are in Direct calibration mode, and will then say 'InHi'.

3. It will then show the existing In.Hi value, which you can edit, as follows.

4. Press the 'Digit' button repeatedly, to highlight individual digits.

5. Edit each digit with the △ or ▽ buttons until 8.750 is shown (or your actual In.Hi value) and press 'OK'

6. rdHi will appear, then the existing rdHi value, which you can edit, as follows.

7. If you want to change the decimal point posision, press 'Cal Hi' button for 3 seconds and move the decimal point to the desired position with △ or ▽ buttons. 8. Press 'OK' to save.

9. Press the 'Digit' button repeatedly, to highlight individual digits.

10. Edit each digit with the △ or ▽ buttons to set 75.0 (or your actual rdHi value) and press 'OK'

Low calibration point
11. Press 'Cal Lo' button for 3 seconds.

12. The display will say 'theo' to confirm you are in Direct calibration made, and will then say 'InLo'.

13. It will then show the existing InLo value, which you can edit, as follows.

14. Press the 'Digit' button repeatedly, to highlight individual digits.

15. Edit each digit with the △ or ▽ buttons until 2.000 is shown (or your actual InLo value) and press 'OK'

16. rdLo will appear, then the existing rdLo value, which you can edit, as follows.

17. Press the 'Digit' button repeatedly, to highlight individual digits.

18. Edit each digit with the △ or ▽ buttons to set 0.0 (or your actual rdLo value) and press 'OK'

The meter will lock itself automatically within 5 minutes, or immediately, if you switch the meter off then on again.

Quick and Easy


Specifications

Voltage Input signals
-20.000V to +20.000V
maximum functional range.
Input Impedance: 1 Megohm
Open Circuit Response: 0V
Safe Overload Limit: 60V DC
CMRR: 110dB DC to 60Hz.
Isolation: 250VAC
Sensor Excitation signals
Voltage and Current Max. Excitation Voltage = 24V DC
Max. Excitation Current = 30mA DC
Both the excitation voltage and current are monitored and controlled by the meter.

This allows the meter to provide flexible and precise compensation of cabling resistance, whilst maintaining the sensor's excitation at a level for best signal to noise ratio, depending on which sensor type you use.

Changes in the sensor's excitation conditions allow the meter to give instant diagnostic messages. These help you to quickly identify and correct any external wiring or sensor faults which may occur during or after installation.


Permanent Display value...


How to stabilise your reading if the signal is varying due to vibration, electrical interference etc.


After basic direct or theoretical calibration, you can easily linearise your system if its errors are repeatable.


How to change the display resolution: Count by 1,2,5,10,20 or 50


How to offset the display


How to re-scale for different units without re-calibrating


Automatic drift cancelling


System Diagnostics

Diagnostics

If something is wrong with your measurement system, we will tell you about it with these messages:

i.u.r. 
Input Under Range. This means the input signal is very low, below the normal low signal level we would normally expect for the chosen signal type.

i.o.r. 
Input Over Range. This means the input signal is very high, above the normal high signal level we would normally expect for the chosen signal type.

d.u.r. 
Display Under Range. This means the display does not have enough digits to show the very low value being measured. Example, trying to display less than -199999 on a 6 digit display.

d.o.r. 
Display Over Range. This means the display does not have enough digits to show the very high value being measured. Example, trying to display more than 999999 on a 6 digit display.

-SC- 
Short Circuit. This means we have detected a Short Circuit in your sensor wiring.

-OC- 
Open Circuit. This means we have detected an Open Circuit in your sensor wiring.

x  icon flashing red
Unexpected input wiring resistance change. There is an error or change in your sensor wiring. The cabling resistance is higher or lower than when the meter was first installed.

All decimal points flashing red, no digits
The main board has stopped communicating with the display board.


We are here to help you!

We can help you!

Your question or comment


Your name


Your email address


Our privacy statement
Form Index: 11


4-20mA input mode

print

Loop excitation is available, if you need it. The excitation is current limited to 30mA.

It is easy to calibrate and has many useful features.

How to connect an active 4-20mA signal to your meter

Suitable if the signal is coming from an active device sending 4-20mA out.

4-20mA input connections - active
The meter can accept an input range of -40 to +40 mA DC in this mode.

It will tolerate up to 30V DC across the current input terminals without damage.

The input is electrically isolated from power and output ports


How to connect a passive 4-20mA transmitter to your meter

Connecting and powering a 2 wire pressure, temperature or humidity transmitters, for example.

The meter gives 24V DC excitation for the transmitter.

4-20mA input connections - passive


How to choose sensor type:  4-20

Unlock the calibration menu, set Ed.CF

1. Press buttons 1 and 2 together for at least 6 seconds.

The display will say:

      typE

2. Press the △ or ▽ button repeatedly until you see:

     4-20

3. Press  OK

You only need to do this procedure when you first install your meter or when you want to change the meter's sensor type.


digital panel meter front lens
4
-
2
0


How to calibrate your meter

There are 2 calibration methods available:

Direct Calibration method:

Direct calibration is more accurate, because it calibrates the whole system, including the sensor.

1. Connect your sensor to the meter and to your process.

You must be able to adjust the process to two precisely known values, ideally at 0% and 100% of your measurement range, but you can use any 2 well separated points.

You will adjust the meter to read those two calibration values.

2. If the meter is locked, unlock the calibration menu

3. Press 'Cal Lo' and 'Cal Hi' together for 3 seconds until you see 'C.Src' (calibration source)

4. Press the △ or ▽ button repeatedly until you see: 'dir' then press 'OK'


Example Calibration:

Calibrate the meter with an input signal range of 4.000mA to 20.000mA, to display 0.0 to 60.0

High Calibration point:
  In.Hi = 20.000 mA
  rd.Hi = 60.0

Low Calibration point:
  InLo = 4.000 mA
  rd.Lo = 0.0

We will also check the middle of the range at 12mA input, to verify that the display shows 30.0

Method ...


High calibration point
1. Press 'Cal Hi' button for 3 seconds.

2. The display will say 'dir' to confirm you are in Direct calibration made, and will then say 'InHi'.

3. Apply the high level calibration signal 20.000mA in the example, and press 'OK'

4. The display will now briefly say 'rd.Hi' to confirm you are in the High Reading setting.

5. To set decimal point position, press 'Cal Hi' button again for 3 seconds and move the decimal point to the desired position with △ or ▽ buttons. Press 'OK' to save.

6. Press 'Digit' button to select each digit and edit with the △ or ▽ buttons to show 60.0 or your desired high reading. Press 'OK' when all digits are correct.


Low calibration point
7. Press 'Cal Lo' button for 3 seconds.

8. The display will say 'dir' to confirm you are in Direct calibration made, and will then say 'InLo'.

9. Apply the low level calibration signal 4.000mA in the example, and press 'OK'

10. The display will now briefly say 'rd.Lo' to confirm you are in the Low Reading setting.

11. Press 'Digit' button to select each digit and edit with the △ or ▽ buttons to show 0.0 or your desired low reading. Press 'OK' when all digits are correct.


12. Apply 50% of input range, so 12.000mA in the example and ensure the display reads 50% of display range, being 30.0 in the example.

The meter will lock itself automatically within 5 minutes, or immediately, if you switch the meter off then on again.


Theoretical Calibration method:

Theoretical calibration allows you to define two input and corresponding display values, without needing to connect a sensor to the display.

It is not as accurate as Direct calibration, because we do not include the sensor in the calibration, but it is useful as an approximate calibration method.

1. If the meter is locked, unlock the calibration menu

2. Press 'Cal Lo' and 'Cal Hi' together for 3 seconds until you see 'C.Src' (calibration source)

3. Press the △ or ▽ button repeatedly until you see: 'thEo' then press 'OK'


Example Calibration:

Calibrate the meter with a theoretical input signal range of 4.000 mA to 20.000 mA, to display 0.0 to 75.0

High Calibration point:
  InHi = 20.000 mA
  rdHi = 75.0

Low Calibration point:
  InLo = 4.000 mA
  rdLo = 0.0

Method...


High calibration point
1. Press 'Cal Hi' button for 3 seconds.

2. The display will say 'theo' to confirm you are in Direct calibration mode, and will then say 'InHi'.

3. It will then show the existing In.Hi value, which you can edit, as follows.

4. Press the 'Digit' button repeatedly, to highlight individual digits.

5. Edit each digit with the △ or ▽ buttons until 20.000 is shown (or your actual In.Hi value) and press 'OK'

6. rdHi will appear, then the existing rdHi value, which you can edit, as follows.

7. If you want to change the decimal point posision, press 'Cal Hi' button for 3 seconds and move the decimal point to the desired position with △ or ▽ buttons. 8. Press 'OK' to save.

9. Press the 'Digit' button repeatedly, to highlight individual digits.

10. Edit each digit with the △ or ▽ buttons to set 75.0 (or your actual rdHi value) and press 'OK'

Low calibration point
11. Press 'Cal Lo' button for 3 seconds.

12. The display will say 'theo' to confirm you are in Direct calibration made, and will then say 'InLo'.

13. It will then show the existing InLo value, which you can edit, as follows.

14. Press the 'Digit' button repeatedly, to highlight individual digits.

15. Edit each digit with the △ or ▽ buttons until 4.000 is shown (or your actual InLo value) and press 'OK'

16. rdLo will appear, then the existing rdLo value, which you can edit, as follows.

17. Press the 'Digit' button repeatedly, to highlight individual digits.

18. Edit each digit with the △ or ▽ buttons to set 0.0 (or your actual rdLo value) and press 'OK'

The meter will lock itself automatically within 5 minutes, or immediately, if you switch the meter off then on again.


Specifications

Current Input signals
-40.000 to +40.000mA maximum functional rangeInput Impedance: 2.5 Ohms

Open Circuit Response: 0mA

Safe Overload Limit: High current capacity up to 30V DC permanently applied across current input terminals. The input shunt resistors are automatically protected from accidental connection to high current 24V DC supplies or other potentially damaging signals.
CMRR: 110dB DC to 60Hz.
Isolation: 250VAC
Sensor Excitation signals
Voltage and Current Max. Excitation Voltage = 24V DC

Max. Excitation Current = 30mA DC

Both the excitation voltage and current are monitored and controlled by the meter.

This allows the meter to provide flexible and precise compensation of cabling resistance, whilst maintaining the sensor's excitation at a level for best signal to noise ratio, depending on which sensor type you use.

Changes in the sensor's excitation conditions allow the meter to give instant diagnostic messages. These help you to quickly identify and correct any external wiring or sensor faults which may occur during or after installation.


Permanent Display value...


How to stabilise your reading if the signal is varying due to vibration, electrical interference etc.


After basic direct or theoretical calibration, you can easily linearise your system if its errors are repeatable.


How to change the display resolution: Count by 1,2,5,10,20 or 50


How to offset the display


How to re-scale for different units without re-calibrating


Automatic drift cancelling


System Diagnostics

Diagnostics

If something is wrong with your measurement system, we will tell you about it with these messages:

i.u.r. 
Input Under Range. This means the input signal is very low, below the normal low signal level we would normally expect for the chosen signal type.

i.o.r. 
Input Over Range. This means the input signal is very high, above the normal high signal level we would normally expect for the chosen signal type.

d.u.r. 
Display Under Range. This means the display does not have enough digits to show the very low value being measured. Example, trying to display less than -199999 on a 6 digit display.

d.o.r. 
Display Over Range. This means the display does not have enough digits to show the very high value being measured. Example, trying to display more than 999999 on a 6 digit display.

-SC- 
Short Circuit. This means we have detected a Short Circuit in your sensor wiring.

-OC- 
Open Circuit. This means we have detected an Open Circuit in your sensor wiring.

x  icon flashing red
Unexpected input wiring resistance change. There is an error or change in your sensor wiring. The cabling resistance is higher or lower than when the meter was first installed.

All decimal points flashing red, no digits
The main board has stopped communicating with the display board.


We are here to help you!

We can help you!

Your question or comment


Your name


Your email address


Our privacy statement
Form Index: 12


RTD / PT100 input mode

print

Accepts 2,3 or 4 wire RTD of PT100 specification.

Can display Centigrade, Fahrenheit, Kelvin and Rankine and has 0.1 degree or 1 degree selectable resolution.

PT100 RTD connection to digital panel meter

It constantly checks your system resistance to give you early warning of any unexpected changes caused by moisture in junction boxes, corroded connections etc.

How to choose sensor type:  rtdA

Unlock the calibration menu, set Ed.CF

1. Press buttons 1 and 2 together for at least 6 seconds.

The display will say:

      typE

2. Press the △ or ▽ button repeatedly until you see:

     rtdA

3. Press  OK

You only need to do this procedure when you first install your meter or when you want to change the meter's sensor type.


digital panel meter front lens
r
t
d
A
Deg
C


For PT1000, select RTD.b

digital panel meter front lens
r
t
d
b
Deg
C


4. Select Temperature Units

Press the △ or ▽ button repeatedly until you see the temperature units you want...

°C Celcius/Centigrade
°F Fahrenheit
°k Kelvin
°r Rankine

Press OK to save.
----------------

5. Set Resolution

Press the △ or ▽ button repeatedly until you see the resolution you want...

1 deg resolution
0.1° 0.1 deg resolution

Press OK to save.
----------------


further information This video shows how to set up your PT100 display.

Quick and Easy


Permanent Display value...


How to stabilise your reading if the signal is varying due to vibration, electrical interference etc.


How to offset the display


System Diagnostics

Diagnostics

If something is wrong with your measurement system, we will tell you about it with these messages:

i.u.r. 
Input Under Range. This means the input signal is very low, below the normal low signal level we would normally expect for the chosen signal type.

i.o.r. 
Input Over Range. This means the input signal is very high, above the normal high signal level we would normally expect for the chosen signal type.

d.u.r. 
Display Under Range. This means the display does not have enough digits to show the very low value being measured. Example, trying to display less than -199999 on a 6 digit display.

d.o.r. 
Display Over Range. This means the display does not have enough digits to show the very high value being measured. Example, trying to display more than 999999 on a 6 digit display.

-SC- 
Short Circuit. This means we have detected a Short Circuit in your sensor wiring.

-OC- 
Open Circuit. This means we have detected an Open Circuit in your sensor wiring.

x  icon flashing red
Unexpected input wiring resistance change. There is an error or change in your sensor wiring. The cabling resistance is higher or lower than when the meter was first installed.

All decimal points flashing red, no digits
The main board has stopped communicating with the display board.


We are here to help you!

We can help you!

Your question or comment


Your name


Your email address


Our privacy statement
Form Index: 13


DC Shunt / mV input mode

print

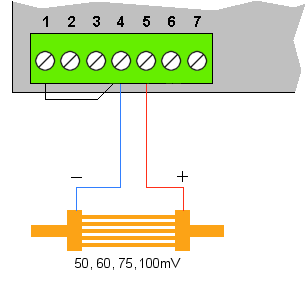
DC Shunt input mode is ideal for all DC current measurements, including electroplating.

It accepts shunts of all current ratings, with mV outputs from 5mV full scale to 100mV full scale.

connections for DC Shunt input

How to choose sensor type:  Shnt

Unlock the calibration menu, set Ed.CF

1. Press buttons 1 and 2 together for at least 6 seconds.

The display will say:

      typE

2. Press the △ or ▽ button repeatedly until you see:

     Shnt

3. Press  OK

You only need to do this procedure when you first install your meter or when you want to change the meter's sensor type.


digital panel meter front lens
5
h
n
t
A
DC


How to calibrate your meter

There are 2 calibration methods available:

Direct Calibration method:

Direct calibration is more accurate, because it calibrates the whole system, including the shunt.

1. Connect your shunt to the meter and to your process.

You must be able to adjust the process to two precisely known current values, ideally at 0% and 100% of your measurement range, but you can use any 2 well separated points.

You will adjust the meter to read those two calibration values.

2. If the meter is locked, unlock the calibration menu

3. Press 'Cal Lo' and 'Cal Hi' together for 3 seconds until you see 'C.Src' (calibration source)

4. Press the △ or ▽ button repeatedly until you see: 'dir' then press 'OK'


Example Calibration:

Calibrate the meter with an input signal range of 0A to 250 A to the shunt, to display 0.0 to 250.0

High Calibration point:
  In.Hi = 250 A
  rd.Hi = 250.0

Low Calibration point:
  InLo = 0 A
  rd.Lo = 0.0

We will also check the middle of the range at 125 A input, to verify that the display shows 125.0

Method ...


High calibration point
1. Press 'Cal Hi' button for 3 seconds.

2. The display will say 'dir' to confirm you are in Direct calibration made, and will then say 'InHi'.

3. Apply the high level calibration signal 250A in the example, and press 'OK'

4. The display will now briefly say 'rd.Hi' to confirm you are in the High Reading setting.

5. To set decimal point position, press 'Cal Hi' button again for 3 seconds and move the decimal point to the desired position with △ or ▽ buttons. Press 'OK' to save.

6. Press 'Digit' button to select each digit and edit with the △ or ▽ buttons to show 250.0 or your desired high reading. Press 'OK' when all digits are correct.


Low calibration point
7. Press 'Cal Lo' button for 3 seconds.

8. The display will say 'dir' to confirm you are in Direct calibration made, and will then say 'InLo'.

9. Apply the low level calibration signal 0 A in the example, and press 'OK'

10. The display will now briefly say 'rd.Lo' to confirm you are in the Low Reading setting.

11. Press 'Digit' button to select each digit and edit with the △ or ▽ buttons to show 0.0 or your desired low reading. Press 'OK' when all digits are correct.


12. Apply 50% of input range, so 125 A in the example and ensure the display reads 50% of display range, being 125.0 in the example.

The meter will lock itself automatically within 5 minutes, or immediately, if you switch the meter off then on again.


Theoretical Calibration method:

Theoretical calibration allows you to define two input and corresponding display values, without needing to connect a shunt to the display.

It is not as accurate as Direct calibration, because we do not include the shunt in the calibration, but it is useful as an approximate calibration method.

1. If the meter is locked, unlock the calibration menu

2. Press 'Cal Lo' and 'Cal Hi' together for 3 seconds until you see 'C.Src' (calibration source)

3. Press the △ or ▽ button repeatedly until you see: 'thEo' then press 'OK'


Example Calibration:

In this example, we will use a 400 A shunt, giving 0-60mV

Calibrate the meter with a theoretical input signal range of 0.000 mV to 60.000 mV, to display 0.0 to 400.0 A

High Calibration point:
  InHi = 60.000 mV
  rdHi = 400.0

Low Calibration point:
  InLo = 0.000 mV
  rdLo = 0.0

Method...


High calibration point
1. Press 'Cal Hi' button for 3 seconds.

2. The display will say 'theo' to confirm you are in Direct calibration mode, and will then say 'InHi'.

3. It will then show the existing In.Hi value, which you can edit, as follows.

4. Press the 'Digit' button repeatedly, to highlight individual digits.

5. Edit each digit with the △ or ▽ buttons until 60.000 is shown (or your actual In.Hi value) and press 'OK'

6. rdHi will appear, then the existing rdHi value, which you can edit, as follows.

7. If you want to change the decimal point posision, press 'Cal Hi' button for 3 seconds and move the decimal point to the desired position with △ or ▽ buttons. 8. Press 'OK' to save.

9. Press the 'Digit' button repeatedly, to highlight individual digits.

10. Edit each digit with the △ or ▽ buttons to set 400.0 (or your actual rdHi value) and press 'OK'

Low calibration point
11. Press 'Cal Lo' button for 3 seconds.

12. The display will say 'theo' to confirm you are in Direct calibration made, and will then say 'InLo'.

13. It will then show the existing InLo value, which you can edit, as follows.

14. Press the 'Digit' button repeatedly, to highlight individual digits.

15. Edit each digit with the △ or ▽ buttons until 0.000 is shown (or your actual InLo value) and press 'OK'

16. rdLo will appear, then the existing rdLo value, which you can edit, as follows.

17. Press the 'Digit' button repeatedly, to highlight individual digits.

18. Edit each digit with the △ or ▽ buttons to set 0.0 (or your actual rdLo value) and press 'OK'

The meter will lock itself automatically within 5 minutes, or immediately, if you switch the meter off then on again.


Specifications

Voltage Input signals
-100.50mV to +100.50mV
maximum functional range.
Input Impedance: 10 Megohm
Open Circuit Response: -0r- Upscale
Safe Overload Limit: 60V DC
CMRR: 110dB DC to 60Hz.
Isolation: 250VAC
Accuracy+/- 0.05% of range
Stability+/- 50ppm/Degree C


Permanent Display value...


How to stabilise your reading if the signal is varying due to electrical interference etc.


After basic direct or theoretical calibration, you can easily linearise your system if its errors are repeatable.


How to change the display resolution: Count by 1,2,5,10,20 or 50


How to offset the display


How to re-scale for different units without re-calibrating


Automatic drift cancelling


System Diagnostics

Diagnostics

If something is wrong with your measurement system, we will tell you about it with these messages:

i.u.r. 
Input Under Range. This means the input signal is very low, below the normal low signal level we would normally expect for the chosen signal type.

i.o.r. 
Input Over Range. This means the input signal is very high, above the normal high signal level we would normally expect for the chosen signal type.

d.u.r. 
Display Under Range. This means the display does not have enough digits to show the very low value being measured. Example, trying to display less than -199999 on a 6 digit display.

d.o.r. 
Display Over Range. This means the display does not have enough digits to show the very high value being measured. Example, trying to display more than 999999 on a 6 digit display.

-SC- 
Short Circuit. This means we have detected a Short Circuit in your sensor wiring.

-OC- 
Open Circuit. This means we have detected an Open Circuit in your sensor wiring.

x  icon flashing red
Unexpected input wiring resistance change. There is an error or change in your sensor wiring. The cabling resistance is higher or lower than when the meter was first installed.

All decimal points flashing red, no digits
The main board has stopped communicating with the display board.


We are here to help you!

We can help you!

Your question or comment


Your name


Your email address


Our privacy statement
Form Index: 14


Thermocouple meter mode

print

Thermocouple mode is ideal for all temperature measurements using type B, E, J, K, N, R, S or T thermocouples

Can display Centigrade, Fahrenheit, Kelvin and Rankine. It has 0.1 degree or 1 degree selectable resolution.

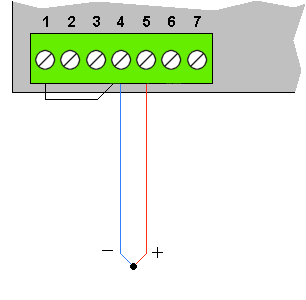
Thermocouple connection to digital panel meter with Auto CJ compensation

You can use its internal cold junction compensation or you can use your own external fixed temperature cold junction.

How to choose sensor type:  tc t

Unlock the calibration menu, set Ed.CF

1. Press buttons 1 and 2 together for at least 6 seconds.

The display will say:

      typE

2. Press the △ or ▽ button repeatedly until you see:

     tc t

3. Press  OK

You only need to do this procedure when you first install your meter or when you want to change the meter's sensor type.


Example showing Thermocouple Type T selection.
Choose the last letter to suit your sensor type.

digital panel meter front lens
t
C
t
Deg
C


You can choose from these thermocouple types:


Colour codes are shown for IEC 584-3

MenuNameStandard UsageIntrinsically Safe
tc bType Bthermocouple type Bthermocouple type B Intrinsically Safe
tc EType Ethermocouple type Ethermocouple type E Intrinsically Safe
tc JType Jthermocouple type Jthermocouple type J Intrinsically Safe
tc kType Kthermocouple type Kthermocouple type K Intrinsically Safe
tc nType Nthermocouple type Nthermocouple type N Intrinsically Safe
tc rType Rthermocouple type Rthermocouple type R Intrinsically Safe
tc SType Sthermocouple type Sthermocouple type S Intrinsically Safe
tc tType Tthermocouple type Tthermocouple type T Intrinsically Safe


You must wire intrinsically safe thermocouple cable through suitable barriers before it connects to the meter, if the thermocouple is in a hazardous area.

Press OK to save.


3. Select Temperature Units

Press the △ or ▽ button repeatedly until you see the temperature units you want...

Celcius/Centigrade = °C

Fahrenheit = °F

Kelvin = °k

Rankine = °r

To save, press OK


4. Set Resolution

Press the △ or ▽ button repeatedly until you see the resolution you want...

1 deg resolution
  
0.1° 0.1 deg resolution


To save, press OK


5. Choose Cold Junction Compensation

Press the △ or ▽ button repeatedly until you see the Cold Junction compensation you want...

In most applications, you would choose ...

Auto

but you can also set a fixed cold junction temperature, for special applications.


Automatic CJ compensation (default) = Auto

45 Degree Cold Junction = CJ:45

You can edit the 45 degree value from 00 to 99 degrees.

To save, press OK


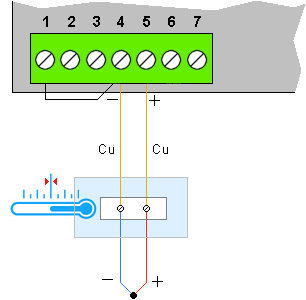
Higher precision connection method using an external fixed cold junction. Triple-point cells or oven-controlled 45 Deg C references are commonly used.

Thermocouple connection to digital panel meter with Fixed CJ compensation

This method is useful when the cable length from thermocouple to meter is long, because you can use lower cost copper for much of the cabling distance, instead of more costly extension cable.

More importantly though, the environment of the cold junction can be more precisely defined than the typical ambient conditions at the back of a meter in a general purpose control panel. This has the benefit of higher precision and stability under changing ambient temperature conditions.

Specifications

Standard Meter: Thermocouples
All can be set for Deg. C, Deg. F, Deg. K or Deg. R
All can be set for 1 or 0.1 Deg Resolution
All cover the standard full range of the sensor

Thermocouple Type B: +250 to 1700 Deg C
Thermocouple Type E: -270 to 1000 Deg C
Thermocouple Type J: -210 to + 760 Deg C
Thermocouple Type K: -200 to + 1300 Deg C
Thermocouple Type N: -200 to + 1280 Deg C
Thermocouple Type R: -40 to + 1480 Deg C
Thermocouple Type S: -50 to + 1600 Deg C
Thermocouple Type T: -200 to + 370 Deg C

Automatic or fixed user-specified cold-junction temperature.
Precison+/- 0.5 degrees C max linearity error.

CJ Error less than 0.1 degree per degree of ambient change.


Permanent Display value...


How to stabilise your reading if the signal is varying due to vibration, electrical interference etc.


How to offset the display


System Diagnostics

Diagnostics

If something is wrong with your measurement system, we will tell you about it with these messages:

i.u.r. 
Input Under Range. This means the input signal is very low, below the normal low signal level we would normally expect for the chosen signal type.

i.o.r. 
Input Over Range. This means the input signal is very high, above the normal high signal level we would normally expect for the chosen signal type.

d.u.r. 
Display Under Range. This means the display does not have enough digits to show the very low value being measured. Example, trying to display less than -199999 on a 6 digit display.

d.o.r. 
Display Over Range. This means the display does not have enough digits to show the very high value being measured. Example, trying to display more than 999999 on a 6 digit display.

-SC- 
Short Circuit. This means we have detected a Short Circuit in your sensor wiring.

-OC- 
Open Circuit. This means we have detected an Open Circuit in your sensor wiring.

x  icon flashing red
Unexpected input wiring resistance change. There is an error or change in your sensor wiring. The cabling resistance is higher or lower than when the meter was first installed.

All decimal points flashing red, no digits
The main board has stopped communicating with the display board.


We are here to help you!

We can help you!

Your question or comment


Your name


Your email address


Our privacy statement
Form Index: 15


Potentiometer mode

print

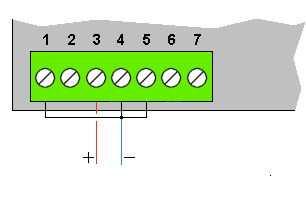
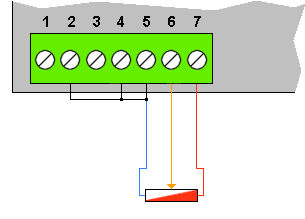
Potentiometer mode is ideal for all position, displacement and angle applications using a resistive 3 wire potentiometer as the sensor.

3 wire Potentiometer input connection for digital panel meter

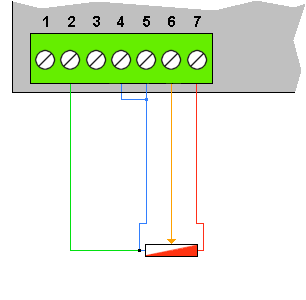
You can use 4 wire connection to reduce the effect of cable resistance ...

4 wire Potentiometer input connection for digital panel meter

It checks your system resistance to give you early warning of any unexpected changes caused by moisture in junction boxes, corroded connections etc.

How to choose sensor type:  POt

Unlock the calibration menu, set Ed.CF

1. Press buttons 1 and 2 together for at least 6 seconds.

The display will say:

      typE

2. Press the △ or ▽ button repeatedly until you see:

     POt

3. Press  OK

You only need to do this procedure when you first install your meter or when you want to change the meter's sensor type.


digital panel meter front lens
P
O
t
%


digital panel meter front lens
r
E
5
%


digital panel meter front lens
0
1
0
3


digital panel meter front lens
r
5
t
n
%


digital panel meter front lens
r
5
t
Y
%


3. Press the △ or ▽ button repeatedly until you see Pot

4. Press OK to save.


Permanent Display value...


How to stabilise your reading if the signal is varying due to vibration, electrical interference etc.


After basic direct or theoretical calibration, you can easily linearise your system if its errors are repeatable.


How to change the display resolution: Count by 1,2,5,10,20 or 50


How to offset the display


How to re-scale for different units without re-calibrating


Automatic drift cancelling


System Diagnostics

Diagnostics

If something is wrong with your measurement system, we will tell you about it with these messages:

i.u.r. 
Input Under Range. This means the input signal is very low, below the normal low signal level we would normally expect for the chosen signal type.

i.o.r. 
Input Over Range. This means the input signal is very high, above the normal high signal level we would normally expect for the chosen signal type.

d.u.r. 
Display Under Range. This means the display does not have enough digits to show the very low value being measured. Example, trying to display less than -199999 on a 6 digit display.

d.o.r. 
Display Over Range. This means the display does not have enough digits to show the very high value being measured. Example, trying to display more than 999999 on a 6 digit display.

-SC- 
Short Circuit. This means we have detected a Short Circuit in your sensor wiring.

-OC- 
Open Circuit. This means we have detected an Open Circuit in your sensor wiring.

x  icon flashing red
Unexpected input wiring resistance change. There is an error or change in your sensor wiring. The cabling resistance is higher or lower than when the meter was first installed.

All decimal points flashing red, no digits
The main board has stopped communicating with the display board.


We are here to help you!

We can help you!

Your question or comment


Your name


Your email address


Our privacy statement
Form Index: 16


Power Frequency mode

print

If your model number includes 'PFR' and the meter is AC powered, you can display precise power frequency.

Frequency is displayed to 3 decimal places.

digital panel meter front lens
5
0
0
3
8
Hz


It is a factory/distributor installed option: Activation command = PwrOpto1

Range 47.000 to 63.000 Hz. 95-265V AC. The meter measures the frequency of its own power voltage, no auxiliary connection is needed.

How to choose sensor type:  P.FrE

Unlock the calibration menu, set Ed.CF

1. Press buttons 1 and 2 together for at least 6 seconds.

The display will say:

      typE

2. Press the △ or ▽ button repeatedly until you see:

     P.FrE

3. Press  OK

You only need to do this procedure when you first install your meter or when you want to change the meter's sensor type.


digital panel meter front lens
P
F
r
E
Hz


digital panel meter front lens
6
0
0
1
4
Hz


Are you in Great Britain? This live frequency monitor for the GB national power grid is a useful calibration aid.


How to change the display resolution: Count by 1,2,5,10,20 or 50


Display hold, Tare, Reset, Show Peak, Show Valley, Show Nett, Gross, Heads-Up format ...


How to offset the display


How to fine-calibrate your frequency meter (not normally required)


further information This video demonstrates the power frequency display, compared to a UK online grid frequency reference at http://mainsfrequency.uk/fm-fullscreen


Quick and Easy


We are here to help you!

We can help you!

Your question or comment


Your name


Your email address


Our privacy statement
Form Index: 17


Resistance Meter mode

print

Resistance mode is ideal for measuring and checking the resistance of components such as inductors, heaters, transformers and earth bonds.

The meter's pass/fail alarm modes let you easily enter an acceptable range of resistance, as well as individual high or low alarms to form an effective Quality Assurance system on your production line.

Precision 4 wire resistance connection to digital panel meter

The 4-wire connection gives high performance cable resistance compensation, thanks to our new patented signal processor.

It constantly checks your system resistance to give you early warning of any unexpected changes caused by moisture in junction boxes, corroded connections etc.

How to choose sensor type:  rE5

Unlock the calibration menu, set Ed.CF

1. Press buttons 1 and 2 together for at least 6 seconds.

The display will say:

      typE

2. Press the △ or ▽ button repeatedly until you see:

     rE5

3. Press  OK

You only need to do this procedure when you first install your meter or when you want to change the meter's sensor type.


digital panel meter front lens
r
e
5
Ohm


You can now set the maximum resistance value you want to measure...

digital panel meter front lens
r
t
o
p
Ohm


Ranges available are:

Low Ranges
RangeScreen PromptExcitation Current
1 Ohm max.1 r50mA
10 Ohm max.10 r5mA
100 Ohm max.100r0.5mA
High Ranges
RangeScreen PromptExcitation Current
1 kilOhm max.1 th (1 thousand)50uA
10 kilOhm max.10th (10 thousand)5uA
40 kilOhm max.40th (40 thousand)1.25uA


There is no user scaling in the setup. If you want to scale the readings, you can use Scale and Offset.

RangeDisplay resolution
1 Ohm max.0 - 999.9 mOhms
10 Ohm max.0.000 to 9.999 Ohms
100 Ohm max.0.00 to 99.99 Ohms
1 kilOhm max.0.0 to 999.9 Ohms
10 kilOhm max.0 to 9999 Ohms
40 kilOhm max.0 to 40.00 kilOhms


Example, the 10 Ohm range is chosen with this prompt...

digital panel meter front lens
1
0
r
Ohm


The 1 kilohm range is chosen with this prompt...

digital panel meter front lens
1
t
h
Ohm


3. Press the △ or ▽ button repeatedly until you see

rES

4. Press OK to save.


Permanent Display value...


How to stabilise your reading if the signal is varying due to electrical interference etc.


After basic direct or theoretical calibration, you can easily linearise your system if its errors are repeatable.


How to change the display resolution: Count by 1,2,5,10,20 or 50


How to offset the display


How to re-scale for different units without re-calibrating


Automatic drift cancelling


System Diagnostics

Diagnostics

If something is wrong with your measurement system, we will tell you about it with these messages:

i.u.r. 
Input Under Range. This means the input signal is very low, below the normal low signal level we would normally expect for the chosen signal type.

i.o.r. 
Input Over Range. This means the input signal is very high, above the normal high signal level we would normally expect for the chosen signal type.

d.u.r. 
Display Under Range. This means the display does not have enough digits to show the very low value being measured. Example, trying to display less than -199999 on a 6 digit display.

d.o.r. 
Display Over Range. This means the display does not have enough digits to show the very high value being measured. Example, trying to display more than 999999 on a 6 digit display.

-SC- 
Short Circuit. This means we have detected a Short Circuit in your sensor wiring.

-OC- 
Open Circuit. This means we have detected an Open Circuit in your sensor wiring.

x  icon flashing red
Unexpected input wiring resistance change. There is an error or change in your sensor wiring. The cabling resistance is higher or lower than when the meter was first installed.

All decimal points flashing red, no digits
The main board has stopped communicating with the display board.


We are here to help you!

We can help you!

Your question or comment


Your name


Your email address


Our privacy statement
Form Index: 18


Rate / RPM/ Speed mode

print

This accurate Rate measurement system works well in RPM and production line applications, measuring rate over short or long periods.

You can average the rate over a chosen time period, from as little as 1 second up to 24 hours.

Rate / Frequency input connection for digital panel meter

It also works well in flow rate measurement and machine speed applications.

The maximum pulse rate the meter can accept in this mode is 400 per second. It is intended for production line rate measurements.


Signal Types
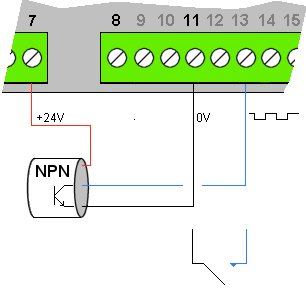
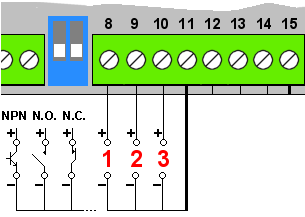
NPN TransistorsSwitching 5V DC at 1mA
Must saturate to lower than 1V Vce
Normally Open ContactsSwitching 5V DC at 1mA
We recommend you use wiping contacts, to mechanically clear any oxidation or tarnishing of the contact surfaces.
Normally Closed ContactsSwitching 5V DC at 1mA
We recommend you use wiping contacts, to mechanically clear any oxidation or tarnishing of the contact surfaces.
De-bounceEach input port has its own configurable de-bounce time which you can adjust to suit your application.
Range 0 to 9999 milli-seconds.


How to choose sensor type:  rAtE

Unlock the calibration menu, set Ed.CF

1. Press buttons 1 and 2 together for at least 6 seconds.

The display will say:

      typE

2. Press the △ or ▽ button repeatedly until you see:

     rAtE

3. Press  OK

You only need to do this procedure when you first install your meter or when you want to change the meter's sensor type.


digital panel meter front lens
r
a
t
e
RPM


4. Press OK to save.

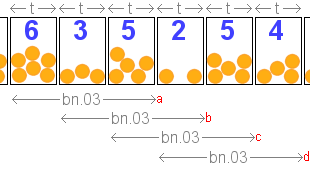
Our rate measuring system uses the concept of 'bins', which is very user-friendly and flexible.

A bin can be filled with the number of counted pulses it receives. You can set the time during which a bin is open. This is shown as t in the diagram.

You can also specify a number of bins to use in your rate measurement, from 1 to 99. In the diagram we have chosen 3 bins, set by the bn.03 parameter.

In this case, we update the display with the number of counts received in the last 3 bins.

If we set t to be 20 seconds, we will show the rate in items per minute, updated every 20 seconds...

So at point a, the display will show 14 (6 + 3 + 5)
So at point b, the display will show 10 (3 + 5 + 2)
So at point c, the display will show 12 (5 + 2 + 5)
So at point d, the display will show 11 (2 + 5 + 4)


binned rate diagram


5. What will be the maximum input frequency (Hz) (floating point)

digital panel meter front lens
P
i
n
RPM


6. What does 1 pulse represent as a quantity. 1 item? A box of 12 items?

digital panel meter front lens
d
I
5
P
RPM


7. How many bins do you want to average?

digital panel meter front lens
b
n
0
3
RPM


8. How long is each bin open for? Seconds.

digital panel meter front lens
t
0
2
0
RPM


9. Scaling - multipy or divide

digital panel meter front lens
5
C
A
L
RPM


further information This video demonstrates how to configure your Rate display

We set ...

P.in = 5
disp = 1.000
bn.10
t.010
SCAL = Mult 0.500
dbnc = 0500

The configuration lockout switch must be off.

Quick and Easy


After basic direct or theoretical calibration, you can easily linearise your system.


System Diagnostics

Diagnostics

If something is wrong with your measurement system, we will tell you about it with these messages:

i.u.r. 
Input Under Range. This means the input signal is very low, below the normal low signal level we would normally expect for the chosen signal type.

i.o.r. 
Input Over Range. This means the input signal is very high, above the normal high signal level we would normally expect for the chosen signal type.

d.u.r. 
Display Under Range. This means the display does not have enough digits to show the very low value being measured. Example, trying to display less than -199999 on a 6 digit display.

d.o.r. 
Display Over Range. This means the display does not have enough digits to show the very high value being measured. Example, trying to display more than 999999 on a 6 digit display.

-SC- 
Short Circuit. This means we have detected a Short Circuit in your sensor wiring.

-OC- 
Open Circuit. This means we have detected an Open Circuit in your sensor wiring.

x  icon flashing red
Unexpected input wiring resistance change. There is an error or change in your sensor wiring. The cabling resistance is higher or lower than when the meter was first installed.

All decimal points flashing red, no digits
The main board has stopped communicating with the display board.


We are here to help you!

We can help you!

Your question or comment


Your name


Your email address


Our privacy statement
Form Index: 19


Rate Settings Optimiser

print


This app will find the best settings for your application.

What do you want the display to show?


We are here to help you!

We can help you!

Your question or comment


Your name


Your email address


Our privacy statement
Form Index: 20


Elapsed Timer mode (up and down timing)

print

Elapsed timer mode is ideal for a wide range of applications, such as process timing, takt timing, countdown to completion etc.

elapsed timer contacts to control start, stop and reset

Simple Start, Stop and Reset contact inputs from your process allow you to set up many common timing tasks.

How to choose sensor type:  ELAP

Unlock the calibration menu, set Ed.CF

1. Press buttons 1 and 2 together for at least 6 seconds.

The display will say:

      typE

2. Press the △ or ▽ button repeatedly until you see:

     ELAP

3. Press  OK

You only need to do this procedure when you first install your meter or when you want to change the meter's sensor type.


You can choose from several timing modes.

Timing formats:
SSSS Seconds
SSS.T Seconds, to 1/10 second
MM:SS Minutes and Seconds
HH:MM Hours and Minutes


Timing direction:
UP Counts up from 0
dn Counts down from preset


Preset:
PrSt You would normally use 'PrSt' in down counting. The 'PrSt' (preset) value sets an amount of time to count down from.

For example, adjust 'PrSt' to 8:00 in format HH:MM
Reset the timer.
The timer will show 08:00 and will count down to 00:00 over a period of 8 hours, for example to show time remaining in a shift.

You can use the 'Stop' control to freeze the down-count during lunch breaks, 'Start' when work re-commences.

Negative Timing: (down counting only)
NEg.n Stops counting and flashes when timer reaches 0.
NEg.Y Continues counting down below 0. Illuminates the x icon when the count is negative.


digital panel meter front lens
E
L
A
P
t


3 pushbuttons: Individual Start, Stop and Reset commands


elapsed timer contacts to control start, stop and reset

Contact 1 = Start timer (brief contact)
Contact 2 - Stop timer (brief contact)
Contact 3 = Reset timer (brief contact)


Up Timer sequence.
elapsed up timer contacts to control start, stop and reset

Down Timer sequence.
elapsed down timer contacts to control start, stop and reset


2 pushbuttons: Start and combined [Stop and Reset] commands


elapsed timer contacts to control start, stop and reset

Contact 1 = Start timer (brief contact)
Contact 2 = Stop and reset timer (brief contact)
Contact 3 = Connect to contact 2


Up Timer sequence.
elapsed up timer contacts to control start, stop and reset

Down Timer sequence.
elapsed down timer contacts to control start, stop and reset


2 pushbuttons: Stop and combined [Start and Reset] commands


elapsed timer contacts to control start, stop and reset

Contact 1 = Start and Reset timer (brief contact)
Contact 2 = Stop timer (brief contact)
Contact 3 = Connect to contact 1


Up Timer sequence.
elapsed up timer contacts to control start, stop and reset

Down Timer sequence.
elapsed down timer contacts to control start, stop and reset


The meter has non-volatile memory, so will store elapsed time and previous contact state when it is switched off.

It will continue running when power returns. This is useful for machine maintenance run-time applications, or in production line timing applications.

Timing stops during power loss.


Functional limitations:

In this mode, the following functional limitations apply:

Serial data output - only available in mode C1 on timers.
Analogue output - Unavailable on timers.


Signal Types
NPN TransistorsSwitching 5V DC at 1mA
Must saturate to lower than 1V Vce
Normally Open ContactsSwitching 5V DC at 1mA
We recommend you use wiping contacts, to mechanically clear any oxidation or tarnishing of the contact surfaces.
Normally Closed ContactsSwitching 5V DC at 1mA
We recommend you use wiping contacts, to mechanically clear any oxidation or tarnishing of the contact surfaces.
De-bounceEach input port has its own configurable de-bounce time which you can adjust to suit your application.
Range 0 to 9999 milli-seconds.


We are here to help you!

We can help you!

Your question or comment


Your name


Your email address


Our privacy statement
Form Index: 21


Totaliser / Counter mode

print

Totaliser mode is ideal for most production counting applications.

It is easy to scale and has non-volatile memory to store your count if power is lost.

totaliser connection for digital panel meter

How to Reset the total:
Connect terminal 10 briefly to terminal 11 to reset your counter.

The maximum pulse rate the meter can accept in this mode is 400 per second. It is intended for production line counting.


How to choose sensor type:  tot

Unlock the calibration menu, set Ed.CF

1. Press buttons 1 and 2 together for at least 6 seconds.

The display will say:

      typE

2. Press the △ or ▽ button repeatedly until you see:

     tot

3. Press  OK

You only need to do this procedure when you first install your meter or when you want to change the meter's sensor type.


digital panel meter front lens
t
o
t
Cans


Specify a whole number of input pulses.

digital panel meter front lens
P
i
n
Cans


Specify how much the display should change when those pulses arrive. (floating point)

digital panel meter front lens
d
I
5
P
Cans


Now you can set a contact debounce filter time in milliseconds.

This gives more reliable counting if you use a switch, relay, pushbutton or other mechanical contact closure device as your input signal.

Set the debounce period according to your maximum input pulse rate:

Max. pulse input frequencydbnc
1 pulse per sec. max.500
10 pulses per sec. max.50
100 pulses per sec. max.5
More than 100 pulses per sec.0


digital panel meter front lens
d
b
n
c
Cans


Press OK to save.


further information This video demonstrates how to adjust your totaliser for 10 input pulses to display 1.5 counts, with debounce time of 500 mS.

The configuration lockout switch must be off.

Quick and Easy


How to change the display resolution: Count by 1,2,5,10,20 or 50


Display hold, Tare, Reset, Show Peak, Show Valley, Show Nett, Gross, Heads-Up format ...


How to offset the display


How to re-scale for different units without re-calibrating


System Diagnostics

Diagnostics

If something is wrong with your measurement system, we will tell you about it with these messages:

i.u.r. 
Input Under Range. This means the input signal is very low, below the normal low signal level we would normally expect for the chosen signal type.

i.o.r. 
Input Over Range. This means the input signal is very high, above the normal high signal level we would normally expect for the chosen signal type.

d.u.r. 
Display Under Range. This means the display does not have enough digits to show the very low value being measured. Example, trying to display less than -199999 on a 6 digit display.

d.o.r. 
Display Over Range. This means the display does not have enough digits to show the very high value being measured. Example, trying to display more than 999999 on a 6 digit display.

-SC- 
Short Circuit. This means we have detected a Short Circuit in your sensor wiring.

-OC- 
Open Circuit. This means we have detected an Open Circuit in your sensor wiring.

x  icon flashing red
Unexpected input wiring resistance change. There is an error or change in your sensor wiring. The cabling resistance is higher or lower than when the meter was first installed.

All decimal points flashing red, no digits
The main board has stopped communicating with the display board.


We are here to help you!

We can help you!

Your question or comment


Your name


Your email address


Our privacy statement
Form Index: 22


Clock mode

print

The model number will include "RTC" if the clock option module is installed.

The Clock mode will display accurate time of day or date in several international standard formats.

It automatically adjusts for summer / winter time, or it can display GMT / UTC / Zulu time.


You can also use it as a Day counter for Days Since Last Accident or to count down days to an event.

It is easy to set up and includes automatic daylight saving time.


How to choose sensor type:  CL

Unlock the calibration menu, set Ed.CF

1. Press buttons 1 and 2 together for at least 6 seconds.

The display will say:

      typE

2. Press the △ or ▽ button repeatedly until you see:

     CL

3. Press  OK

You only need to do this procedure when you first install your meter or when you want to change the meter's sensor type.


If you do not see CL in the list, the real-time clock option board is not fitted in your meter. It is a plug-in option module.

You can set the timer formats to :
HH:MM
HH:MM:SS
DD.MM
MM.DD
DD.MM.YY
MM.DD.YY
YY.MM.DD


You can set Automatic Summer/Winter time correction for Europe and USA, or set for GMT / UTC / Zulu.

If you want to show elapsed or count-down Days, for example to show Days since last Accident, or days until an event, select mode dAY.C


Mode H.M : Local Europe/London time:


Mode H.M.S. Local Europe/London time:


Mode d.M.Y. Local Europe/London date EU format:


Mode M.d.Y. Date, USA format:


Mode Y.M.d. Date, China, Korea format:


Mode dAY.C. Days elapsed.
To count up 1 each day, select UP.

Here showing days elapsed since December 31 last year. To define a number of days already passed, to include days already elapsed, use Load

You can instead count down days to an event. Select mode dn. To set the amount of days remaining now, use Pr.St

digital panel meter front lens
2
6
4


further information This video shows how to select type CL
We then select one of the clock modes.

In this example, we will view all the modes and will select H.M.S.

Quick and Easy


further information This video shows how to adjust your clock to a precision time reference. In this example, we use the Clock page of the meter's online operating manual, which has a precision time reference.

Unlock the meter and press Buttons 1, 2 and 3 together for 3 seconds.

You can set Year , Month, Date, HH and MM.

Set MM to one minute ahead of actual time, then press Button 4. The green Alarm LEDs will flash.

As soon as the time reference reaches this time, press button 4 to synchronise the clock.

Quick and Easy


further information This video shows how to fit the clock board option into your meter.

1. Remove the fastening screw on lower surface. There may be one on the upper surface also, if the meter has output option modules fitted.

2. Remove the front panel

3. Slide the circuit board forward, out of the case.

4. Remove the spare screw from the pillar on the clock board and plug the board onto the row of pins each side of the processor.

5. Turn the main board over and place the screw from the pillar into the hole shown and tighten the screw.

6. Slide the board into the case and re-fit the screw on the lower surface.

7. Re-fit the front panel to the case.

8. To enable the clock, apply power and select type CL.

9. Set the mode you require and check that it operates as you wish.

Quick and Easy


Specifications


Functional limitations:

In this mode, the following functional limitations apply:

Serial data output - only available in mode C1 on clocks.
Analogue output - Unavailable on clocks.


Time referenceInternal crystal oscillator
Summer/Winter correction Automatic summer/winter time correction

Can be disabled to show GMT / UTC / Zulu time

Has internal calendar for European and US time zone changeovers.

Available formats HH:MM:SS (HH:MM on 4 digit displays)
DD.MM.YY calendar

DDD days

Precision +/- 10 seconds per month


We are here to help you!

We can help you!

Your question or comment


Your name


Your email address


Our privacy statement
Form Index: 23


Lineariser

print


Introduction

The lineariser is easy to use. You can switch it on or off at any time, so you can compare linearised and non-linearised responses.

It is located at the end of the display process, so you can enter readings which the un-linearised display shows, and the ideal readings you would like the display to show.

It can linearise all physical displayed values, including rate, total, temperature, load, resistance etc., but excluding time.

It makes a curve having from 3 up to 31 points.

INT5 lineariser location in the signal chain

Examples: You can use the lineariser function to:-

  • Improve the precision of a weighing system which has repeatable non-linearity.
  • Use a liquid pressure sensor at the bottom a curved tank to show actual liquid volume
  • Convert a 4-20mA power factor signal to read signed power factor (4-12mA = -0.5 to -1, 12-20mA = +1 to +0.5)
  • Convert differential pressure across an orifice plate or weir to show flow rate
  • etc...

You can view and edit any part of the lineariser table.

1. Prepare your data

Before you enter any values, record what the display shows, without linearising, at several points and what you want it to show.

For example, in a weighing system, the engineer checked various readings with test weights and wrote down these results...

Adding load: Results with Lineariser off

StepTest Weight (kg)Displayed value (kg)
1:0.00.0
2:100.0100.2
3:200.0200.5
4:300.0300.3
5:400.0400.1
6:500.0500.1


He tested in the reverse direction also, to ensure the errors were repeatable.

Removing load: Results with Lineariser off

StepTest Weight (kg)Displayed value (kg)
7:500.0500.1
8:400.0400.1
9:300.0300.3
10:200.0200.5
11:100.0100.2
12:0.00.0


We can see that the errors are repeatable, they are the same when we add or remove weight, so can be improved with the lineariser.

Note:

Any errors which are not repeatable are normally caused by mechanical problems such as worn or poorly lubricated pulley bearings, loose load cell mountings, moisture in connection boxes or accumulated material which is interfering with the free movement of the load cells.

Non-repeatable errors cannot be corrected with the lineariser - they must be corrected physically.


We will write down our plan for the lineariser...

Our linearisation table

This table is used in the video, at the end of this page.

Un-linearised ValueDesired Value
1:In.010.0 rd.010.0
2:In.02100.2rd.02100.0
3:In.03200.5rd.03200.0
4:In.04300.3rd.04300.0
5:In.05400.1rd.05400.0
6:In.06500.1rd.06500.0


This table has 6 rows, so there are 6 calibration points

Important
In.02 > In.01
In.03 > In.02
In.04 > In.03 ...


2. Activate the lineariser

Press buttons 2 and 3 together for 3 seconds and step through the options with the OK button until you see  Lin.x

Lin.1.  = The lineariser is turned on.
Lin.0.  = The lineariser is turned off.

You can change from one to the other using the UP or DOWN button.

Select  Lin.1. To proceed, press  OK

3. Declare the number of calibration points

The display will say  nr.XX. XX is the number of linearisation points you want to use, from 3 to 31 points. For our example table, we will enter  nr.06 

4. Enter or edit the calibration values for each point

1. To view existing calibration values, press  OK. If you want to edit a point, select each digit you want to edit with  Digit. Use the Up and Down buttons to edit the value. To save a value, press  OK .

You will now see  rd.01.  Press OK to edit it or UP or Down Button skip and move onto another value.

2. Or, press the UP or Down button to move on to the next or previous value.

3. Do this for each point in your table.

5. How to SAVE your linearisation table

When you reach the beginning or end of the list, you will see  SAVE.  To save your lineariser table, press  OK.


further information This video demonstrates how to linearise your meter, using the example settings described on this page.

Quick and Easy


We are here to help you!

We can help you!

Your question or comment


Your name


Your email address


Our privacy statement
Form Index: 24


Contact Closure Logic Inputs

print

The 6 contact closure logic inputs are on the bottom row, between the lockout switches and the power connector.

* If your meter has the P.FrE power frequency function fitted, logic port #6 will not be available.

The ports accept contact closure or NPN inputs


logic input connector

Logic inputs only work when the meter is locked.

See [ How to Lock / Unlock the meter ]


You can configure each contact closure input port to function as follows:-

  • 'rSt'Reset
    Clear counts, Tare, Timer, latched alarms, peak/Valley memory etc.
    Default = logic input #3
  • 'tArE'Tare
    Clear the display value to 0, regardless of weight acting upon load cell
    Default = logic input #1
  • 'HOLd'Hold
    Freeze the meter state at a moment in time
  • 'nEtt'Nett
    Show nett value
  • 'GrOS'Gross
    Show gross value
  • 'PEA.G'Peak Gross
    Show tracking peak (maximum) Gross value. PV LED is Yellow
  • 'VAL.G'Valley Gross
    Show tracking valley (minimum) Gross value. PV LED is Green
  • 'PEA.n'Peak Nett
    Show tracking peak (maximum) Nett value. PV LED is Yellow
  • 'VAL.n'Valley Nett
    Show tracking valley (minimum) Nett value. PV LED is Green
  • 'd.tAr'Display Tare
    Show the Tare amount
  • 'rEV.1'Reverse display
    Show mirror image of the display for Heads-Up
  • 'CJ t'Cold Junction Temperature
    Show the CJ temperature at back of meter.
  • 'nOnE'None
    No function for this logic input
    Default = logic input #2


Peak and valley values update up to 10 times per second, with a maximum bandwidth of 7Hz. This will reduce if you add display averaging / filtering.


Signal Types
NPN TransistorsSwitching 5V DC at 1mA
Must saturate to lower than 1V Vce
Normally Open ContactsSwitching 5V DC at 1mA
We recommend you use wiping contacts, to mechanically clear any oxidation or tarnishing of the contact surfaces.
Normally Closed ContactsSwitching 5V DC at 1mA
We recommend you use wiping contacts, to mechanically clear any oxidation or tarnishing of the contact surfaces.
De-bounceEach input port has its own configurable de-bounce time which you can adjust to suit your application.
Range 0 to 9999 milli-seconds.


How to configure your external contact closure input functions:

How to choose sensor type:  E.CC.x

Unlock the calibration menu

1. Press buttons 3 and 4 together for 3 seconds.

The display will say  diSP

2. Repeatedly press  OK

Stop when you see E.CC.x


4. Press the △ or ▽ button until you see E.CC.Y


5. Press  OK


You will see  CC 1


6. Choose which Contact Closure channel to view or edit - press △ or ▽ button to select a channel.


7. Press  OK


8. Choose the function of that channel with △ or ▽.


9. To save that function, press  OK


10. Choose a debounce time for that channel. The default is 50 mS.

Select each digit in the numeric value with  Digit

Increase or decrease the value of the selected digit with the △ or ▽ button.


11. To save your choice, press  OK


Do this for as many contact closure inputs as you want to configure.

When you are finished go to CC1 and press button 3
You will see SAVE

To save your choices, press  OK. Repeat until you return to the normal display.


We are here to help you!

We can help you!

Your question or comment


Your name


Your email address


Our privacy statement
Form Index: 25


Analogue Output: 4-20mA or 0-10V

print

High precision, isolated and scaleable analogue output plug in option module.

Connections

4-20mA Active Source output. This will drive a current into a passive device such as a moving coil meter. This is the most common 4-20mA output configuration

4-20mA source (active) analogue output connections


4-20mA Passive Sink output. This will modulate a current from a connected external excitation voltage. The output stage acts similar to a 4-20mA 2 wire transmitter

4-20mA sink (passive) analogue output connections


0-10V active output.

0-10V analogue output connections


Unlock the configuration menu.

Press Button 3 for 3 seconds : An Out 

The display will report the analogue output signal range which it is presently set for...

0-20 mA =  0-20
4-20 mA =  4-20
0-10 V =  0-10

Press the △ or ▽ button to select your preferred output signal range.

To save your choice, press  OK

digital panel meter front lens
4
-
2
0


If you want to change your output board function from Voltage to Current, or from Current to Voltage, you must change the internal switch positions on the analogue output module...


See the short video near the end of this page, which will explain how to change the switch positions.


Choose which variable will generate the analogue output...

Press the or button repeatedly to go up and down this list. NEtt
The real-time nett value

GroS
The real-time gross value

PEA.g
The memorised maximum gross value

VAL.g
The memorised minimum gross value

PEA.n
The memorised maximum nett value

VAL.n
The memorised minimum nett value

tArE
The real-time tare value

CJ t
The real-time on-board temperature


digital panel meter front lens
n
E
t
t


To save your choice, press  OK


Now Set the calibration values for your analogue output.

Out.L 
The measurement which generates the minimum analogue output signal. For example 4mA.

digital panel meter front lens
O
u
t
L


It is easy to edit the value:
1. Select each digit in the numeric value with  Digit

2. Increase or decrease the value of the selected digit with the △ or ▽ button.

3. To save your choice, press  OK


Out.H 
The measurement which generates the maximum analogue output signal. For example 20mA.

digital panel meter front lens
O
u
t
H


It is easy to edit the value:
1. Select each digit in the numeric value with  Digit

2. Increase or decrease the value of the selected digit with the △ or ▽ button.

3. To save your choice, press  OK


Specifications

How to installThis is a plug-in module which you can add to your meter at any time. You do not need special tools or software
Available outputsSelect 0-20mA, 4-20mA (active or passive) or 0-10V
Drive resistance 20mA ActiveCan drive into loads from 0 Ohms to 600 Ohms, using the Active output terminals. 16V DC open circuit output.
Drive resistance 20mA PassiveCan modulate loops from 0 Ohms to 1000 Ohms, using the Passive output terminals. 24V DC external drive voltage
Drive resistance 0-10VCan drive into loads greater than 600 Ohms. 30mA short circuit current.
Scaling methodDefine display value for 0mA, 4mA or 0V
Define display value for 20mA or 10V
Data which generates the analogue outputChoose which data your Analogue output will be derived from:

1. Nett Value
2. Gross Value
3. Peak Gross value
4. Valley Gross value
5. Peak Nett value
6. Valley Nett value
7. Tare Value
8. CJT on-board temperature
Galvanic IsolationOptically isolated from all ports up to 250 VAC
ProportionalityYou can scale the analogue output as directly proportional or inversely proportional.

For example, directly proportional: 0 to 50 000 kg on the display produces 4 to 20mA output.

Inversely proportional: 0 to 50 000 kg on the display produces 20 to 4mA output.
Response speedUpdates 10 times per second.
Resolution18 bit resolution
Precision +/- 0.05% of range
Temperature stability +/- 50ppm of range, per Deg C


We are here to help you!

We can help you!

Your question or comment


Your name


Your email address


Our privacy statement
Form Index: 26


Analogue Output: Symmetrical -10 to +10V

print

Unlock the configuration menu.

Press the Output button for 3 seconds.

Isolated scalable Analogue output option -10V to +10V


Specifications

How to installThis is a plug-in module which can be added to your meter at any time. No special tools or software needed.
Available outputsFixed as -10V to +10V
Drive resistance 0-10VCan drive into loads greater than 600 Ohms. 30mA short circuit current.
Scaling methodDefine display reading for -10V
Define display reading for +10V
Source of data used to create analogue outputAnalogue output can be derived from one of several data sources which you can choose from:

1. Display value (default)
2. Nett Value
3. Gross Value
4. Tare Value
5. Raw A/D
Galvanic IsolationOptically isolated from all ports up to 250 VAC
ProportionalityYou can freely scale the analogue output as directly proportional of inversely proportional.

For example, directly proportional could be -50 000 to 50 000 kN on the display produces -10 to +10V output.

Inversely proportional could be -50 000 to 50 000 kN on the display produces +10 to -10V output.
Response speedUpdates 10 times per second.
Resolution18 bit resolution
Precision +/- 0.05% of range
Temperature stability +/- 50ppm of range, per Deg C


We are here to help you!

We can help you!

Your question or comment


Your name


Your email address


Our privacy statement
Form Index: 27


Alarm Relay Output Options

print

Use alarm relays for control, warning and shutoff in many industrial processes.

The INT5 has fail-safe alarms. If power is lost to the meter or if the microprocessor fails, the alarms will be active.

Choose from several output types:

Version SPCO:
Mechanical relay outputs: (most popular)

The contacts will be in this position when no power is connected to the device.
mechanical alarm output relay connectors


Version SSAC:
AC Solid state relay outputs:

The contacts will be open when no power is connected to the device.
solid state alarm output relay connectors


Version SSDC:
DC Solid state relay outputs:

The contacts will be open when no power is connected to the device.
solid state alarm output relay connectors


Each relay is independent and can have a different mode to the other relays.

A status LED, AL1, AL2, AL3 or AL4 shows the status of each alarm channel.

The status LED has 3 colour states...
Yellow means the setpoint has been triggered but the alarm relay has not yet been activated. (if a timer delay is set, for example)

Red means the alarm relay is active.

Not lit means there is no alarm condition and the alarm relay is not active.

You can also make the numeric display change colour whenever the input signal is in an alarm condition. The most recent active alarm will determine the alarm display colour.

1. Alarm modes:
Your meter has many useful alarm modes to help with control and warning applications. Click or tap on any of the modes for more information.


High alarm - alarm occurs if the input signal reaches or exceeds the Setpoint value.


Low alarm - alarm occurs if the input signal falls to or below the Setpoint value.


Pump Control High alarm - alarm occurs if the input signal reaches or exceeds the Upper Setpoint value SEt.H . The relay will stay in that state until the signal drops to or below the Lower Setpoint value SEt.L


Pump Control Low alarm - alarm occurs if the input signal reaches or falls below the Lower Setpoint value SEt.L . The relay will stay in that state until the signal rises to or above the Upper Setpoint value SEt.H


In Band alarm - alarm occurs if the input signal goes within two limits. The lower limit is set with SEt.L and the higher limit is set with SEt.H


Out Band alarm - alarm occurs if the input signal goes outside two limits. The lower limit is set with SEt.L and the higher limit is set with SEt.H


High alarm with manual In-flight compensation. Alarm occurs if the input signal reaches or exceeds the Setpoint value, less the expected in-flight (dribble) amount, which is manually set to a fixed amount.


Low alarm with manual In-flight compensation. Alarm occurs if the input signal reaches or falls below the Setpoint value, plus the expected in-flight (dribble) amount, which is manually set to a fixed amount.


High alarm with automatic adaptive In-flight compensation. Alarm occurs if the input signal reaches or exceeds the Setpoint value, less the expected in-flight (dribble) amount, which is automatically set, according to previous alarm overshoot.


Low alarm with automatic adaptive In-flight compensation. Alarm occurs if the input signal reaches or falls below the Setpoint value, plus the expected in-flight (dribble) amount, which is automatically set, according to previous alarm overshoot.


Latching High alarm - alarm occurs if the input signal reaches or exceeds the Setpoint value. Remains in alarm even if signal returns to a non-alarm level. Can be reset using the reset logic input port.


Latching Low alarm - alarm occurs if the input signal reaches or falls below the Setpoint value. Remains in alarm even if signal returns to a non-alarm level. Can be reset using the reset logic input port.


Pulsed High alarm - alarm occurs if the input signal reaches or exceeds the Setpoint value. The output will pulse once only, for a duration set with t.Out, in a range from 0.1 to 99.9 seconds. The alarm annunciator LED will be red for the duration of the pulse and will be switched off at all other times.


Pulsed Low alarm - alarm occurs if the input signal reaches or falls below the Setpoint value. The output will pulse once only, for a duration set with t.Out, in a range from 0.1 to 99.9 seconds. The alarm annunciator LED will be red for the duration of the pulse and will be switched off at all other times.


This channel is turned off and will not activate its alarm relay under any conditions.


View alarm setpoints:
To view the setpoint level for each alarm relay, briefly press the Alarm button, repeatedly.

The display will be dimmed and the alarm setpoint is represented by the numeric value.

The alarm channel identifier will be flashing. See the example below, where Alarm channel 2 has a setpoint of 1234 ...

digital panel meter front lens
1
2
3
4


Specifications

How to installThis is a plug-in module which can be added to your meter at any time. No special tools or software needed.
Available outputs Option SPCO:
4 x Mechanical Relays
Single Pole Change Over
Device = PE515005
Rated 2A 250VAC Resistive

Option SSAC:
4 x Solid State AC Relays
Single Pole Single Throw
Device = TLP3063
Rated 100mA 250VAC Resistive

Option SSDC:
4 x Solid State DC Relays
Single Pole Single Throw
Device = AQV112KL
Resistance: 2 Ohms Maximum
Rated 500 mA 60 VDC Resistive
Available combinations0, 1 or 2 x Serial comms output Options can be installed, which may be RS232 or RS485, in any combination, as well as any or no analogue output.
IsolationOptically isolated from all ports up to 250 VAC
SpeedUpdates 10 times per second, mechanical response 15mS


You can also specify a minimum amount of time the signal needs to be in alarm for, before the relay will change state. Settable 0-99 seconds

You can also specify a minimum amount of time the signal needs to be out of alarm for, before the relay will change state. Settable 0-99 seconds
Relay statesThe relay can be set to energise or de-energise on alarm. Relays will de-energise on loss of power to the meter or on loss of communication from the microprocessor.
HysteresisThe hysteresis is unidirectional and can be set from 0 to 999999


We are here to help you!

We can help you!

Your question or comment


Your name


Your email address


Our privacy statement
Form Index: 28


High Alarm mode

print


Creates an alarm if the input signal equals or exeeds a setpoint.

Example :
The meter will switch a pump off when the liquid reaches the alarm setpoint level.

If the tank does not have straight sides, you can use the meter's lineariser to convert pressure to volume.

High alarm control

To configure the alarm type
1. Unlock the alarms menu

2. Press the Alarms button repeatedly until your chosen alarm channel annunciator LED flashes. We use Alarm 2 (AL2) for this example.

3. Press and hold the Alarms button for at least 6 seconds until you see ...

digital panel meter front lens
A
C
F
g


You can now view and change the following alarm features...

Use the △ or ▽ buttons to move up or down the list and press OK when you see Hi, to select this mode.


2. Colour when in alarm state
Use the △ or ▽ buttons to move up or down the list and press OK to select.

CoL.G = Green
CoL.Y = Yellow
CoL.r = Red

The highest numbered alarm channel will have the highest colour priority.

If tripped, AL2 will dominate AL1 for colour
If tripped, AL3 will dominate AL2 and AL1 for colour
If tripped, AL4 will dominate AL3, AL2 and AL1 for colour

So, if Alarm 1 has tripped and its alarm colour is Yellow, and Alarm 2 has tripped and its alarm colour is red, the display will be red.

If no alarms are active, the display colour will be the colour chosen in the Colour Setting section.

If you want visual colour cues to critical alarms, place the most critical alarms on the higher alarm channels.


3. Relay energised or de-energised when in alarm
Use the △ or ▽ buttons to move up or down the list and press OK to select.

rL.dE means the relay will de-energise when an alarm condition occurs. This is the recommended option, because it gives failsafe relay action. You will get the same condition if you lose power to meter, which is generally the safest response. On the diagram below, we show relays which de-energise on trip with a green tick.

rL.En means the relay will energise when an alarm condition occurs. This is normally not the best option, because it is not failsafe. You will never get an alarm response if you lose power to the meter, which could be dangerous, so we mark this response with a red cross.


4. Source of comparison data
You can choose which available data within the meter is compared to each alarm setpoint.

nEtt
Only the Nett value will be compared with this alarm setpoint.

GroS
Only the Gross value will be compared with this alarm setpoint.

PEA.G
Only the Peak (maximum) Gross value will be compared with this alarm setpoint.

VAL.G
Only the Valley (minimum) Gross value will be compared with this alarm setpoint.

PEA.n
Only the Peak (maximum) Nett value will be compared with this alarm setpoint.

VAL.n
Only the Valley (minimum) Nett value will be compared with this alarm setpoint.

tARE
Only the Tare value will be compared with this alarm setpoint.

CJ t
Only the ambient temperature sensor value will be compared with this alarm setpoint.


5. Set.Pt
This is the value which the measurement will be compared to. You can edit it using the Digit button to select each digit, and the △ or ▽ buttons to increase or decrease the value of a digit.

To set a negative setpoint, use the Digit button to select the left-hand digit and press the ▽ button to show the negative symbol. eg. -XXX.XX.

You can access the Set.Pt setting either from within the main A.CFG Alarm Configuration, or by pressing the alarm button for only 3 seconds when your chosen alarm annunciator is flashing.


6. Hyst
Hysteresis is often used in filling or simple control applications to prevent the alarm relay from repeatedly energising and de-energising when the signal is near to the setpoint.

If hysteresis is set to 0, the alarm will reset as soon as the signal changes to a level outside the alarm limit.

For example if the signal represents water level and there is turbulence in the liquid, you may find the alarm relay repeatedly switches on and off, even though the average level is not changing. You can prevent this with hysteresis.

If you have a high setpoint of 100.00 and no hysteresis, the alarm will occur at 100.00 and will reset at 99.99.

If you set hysteresis to 0.30, the alarm will occur at 100.0 and will only reset when the measurement drops below 99.70.

Choose the amount of hysteris you need, according to the amount of variability or instability in your signal.

High Alarm relay action

In this example, the setpoint is at 57 and we have set hysteresis to 12.

This means the alarm will trip at 57 and will only reset if the input falls to or below 57-12 = 45.


7. On.tr
This sets a delay, before which the alarm relay will trip, when an alarm condition occurs. You can set it from 00.0 to 99.9 seconds.

on delay before trip

It is useful if your measurement has noise or transient alarm conditions and you do not want brief false alarms.

It requires that the alarm condition remains present for the whole  On.tr  period, before the alarm output will change.

If your trip has this delay set, and an alarm condition occurs, you will see that the alarm annunciator LED will first turn yellow, to indicate that the trip condition has been triggered.

Then after the delay period has passed, the alarm relay will trip and the annunciator LED will turn red.


8. t.out
This sets a timed pulse output duration on your alarm relay. You can set it from 00.0 to 99.9 seconds.

off delay before trip, fixed duration, repeat

You would normally use this setting and On.tr. If you set On.tr to 01.0 and set t.Out to 05.0, the alarm will activate after 1 second, will remain active for 5 seconds, then be inactive for 1 second, active for 5 and so on, for the duration that the alarm is present. The annunciator LED will be yellow during inactive alarm relay periods and red when the alarm relay is active.

If you alarm mode is PuL.H or PuL.L, then you will only get one pulse, whose duration is set by t.Out and it may be delayed by a period set in On.tr. The alarm condition must exist for longer than On.tr for the relay to change state.

off delay before trip


9. OFF.t
This sets a delay, before which the alarm relay will reset, when coming out of an alarm condition. You can set it from 00.0 to 99.9 seconds.

off delay after trip

If your trip has this delay set, and an alarm condition ends, then after the delay period has passed, the alarm relay will reset and the red annunciator LED will turn off.


We are here to help you!

We can help you!

Your question or comment


Your name


Your email address


Our privacy statement
Form Index: 29


Low alarm mode

print


Creates an alarm if the input signal falls below a setpoint.

Example :
The meter will switch the pump off when the liquid drops to the alarm setpoint level.

If the tank does not have straight sides, you can use the meter's lineariser to convert pressure to volume.

Low alarm control

To configure the alarm type
1. Unlock the alarms menu

2. Press the Alarms button repeatedly until your chosen alarm channel annunciator LED flashes. We use Alarm 2 (AL2) for this example.

3. Press and hold the Alarms button for at least 6 seconds until you see ...

digital panel meter front lens
A
C
F
g


You can now view and change the following alarm features...

Use the △ or ▽ buttons to move up or down the list and press OK when you see Hi, to select this mode.


2. Colour when in alarm state
Use the △ or ▽ buttons to move up or down the list and press OK to select.

CoL.G = Green
CoL.Y = Yellow
CoL.r = Red

The highest numbered alarm channel will have the highest colour priority.

If tripped, AL2 will dominate AL1 for colour
If tripped, AL3 will dominate AL2 and AL1 for colour
If tripped, AL4 will dominate AL3, AL2 and AL1 for colour

So, if Alarm 1 has tripped and its alarm colour is Yellow, and Alarm 2 has tripped and its alarm colour is red, the display will be red.

If no alarms are active, the display colour will be the colour chosen in the Colour Setting section.

If you want visual colour cues to critical alarms, place the most critical alarms on the higher alarm channels.


3. Relay energised or de-energised when in alarm
Use the △ or ▽ buttons to move up or down the list and press OK to select.

rL.dE means the relay will de-energise when an alarm condition occurs. This is the recommended option, because it gives failsafe relay action. You will get the same condition if you lose power to meter, which is generally the safest response. On the diagram below, we show relays which de-energise on trip with a green tick.

rL.En means the relay will energise when an alarm condition occurs. This is normally not the best option, because it is not failsafe. You will never get an alarm response if you lose power to the meter, which could be dangerous, so we mark this response with a red cross.


4. Source of comparison data
You can choose which available data within the meter is compared to each alarm setpoint.

nEtt
Only the Nett value will be compared with this alarm setpoint.

GroS
Only the Gross value will be compared with this alarm setpoint.

PEA.G
Only the Peak (maximum) Gross value will be compared with this alarm setpoint.

VAL.G
Only the Valley (minimum) Gross value will be compared with this alarm setpoint.

PEA.n
Only the Peak (maximum) Nett value will be compared with this alarm setpoint.

VAL.n
Only the Valley (minimum) Nett value will be compared with this alarm setpoint.

tARE
Only the Tare value will be compared with this alarm setpoint.

CJ t
Only the ambient temperature sensor value will be compared with this alarm setpoint.


5. Set.Pt
This is the value which the measurement will be compared to. You can edit it using the Digit button to select each digit, and the △ or ▽ buttons to increase or decrease the value of a digit.

To set a negative setpoint, use the Digit button to select the left-hand digit and press the ▽ button to show the negative symbol. eg. -XXX.XX.

You can access the Set.Pt setting either from within the main A.CFG Alarm Configuration, or by pressing the alarm button for only 3 seconds when your chosen alarm annunciator is flashing.


6. Hyst
Hysteresis is often used in filling or simple control applications to prevent the alarm relay from repeatedly energising and de-energising when the signal is near to the setpoint.

If hysteresis is set to 0, the alarm will reset as soon as the signal changes to a level outside the alarm limit.

For example if the signal represents water level and there is turbulence in the liquid, you may find the alarm relay repeatedly switches on and off, even though the average level is not changing. You can prevent this with hysteresis.

If you have a high setpoint of 100.00 and no hysteresis, the alarm will occur at 100.00 and will reset at 99.99.

If you set hysteresis to 0.30, the alarm will occur at 100.0 and will only reset when the measurement drops below 99.70.

Choose the amount of hysteris you need, according to the amount of variability or instability in your signal.

High Alarm relay action

In this example, the setpoint is at 57 and we have set hysteresis to 12.

This means the alarm will trip at 57 and will only reset if the input falls to or below 57-12 = 45.


7. On.tr
This sets a delay, before which the alarm relay will trip, when an alarm condition occurs. You can set it from 00.0 to 99.9 seconds.

on delay before trip low

It is useful if your measurement has noise or transient alarm conditions and you do not want brief false alarms.

It requires that the alarm condition remains present for the whole  On.tr  period, before the alarm output will change.

If your trip has this delay set, and an alarm condition occurs, you will see that the alarm annunciator LED will first turn yellow, to indicate that the trip condition has been triggered.

Then after the delay period has passed, the alarm relay will trip and the annunciator LED will turn red.


8. t.out
This sets a timed pulse output on your alarm relay. You can set the duration from 00.0 to 99.9 seconds.

off delay before trip, fixed duration, repeat

You would normally use this setting and On.tr.

Example:
Set On.tr = 01.0
Set t.Out = 05.0
The alarm will activate after 1 second, will remain active for 5 seconds, then be inactive for 1 second, active for 5 and so on, for the duration that the alarm is present.

The annunciator LED will be yellow during inactive alarm relay periods and red when the alarm relay is active.

If your alarm mode is PuL.H or PuL.L, then you will only get one pulse, whose duration is set by t.Out and it may be delayed by a period set in On.tr. The alarm condition must exist for longer than On.tr for the relay to change state.

off delay before trip


9. OFF.t
This sets a delay, before which the alarm relay will reset, when coming out of an alarm condition. You can set it from 00.0 to 99.9 seconds.

off delay after trip low

If your trip has this delay set, and an alarm condition ends, then after the delay period has passed, the alarm relay will reset and the red annunciator LED will turn off.


We are here to help you!

We can help you!

Your question or comment


Your name


Your email address


Our privacy statement
Form Index: 30


Pump Control High Alarm mode

print


Creates an alarm if the input signal reaches or goes above a setpoint SEt.H. Resets the alarm if the input signal goes below a minimum setpoint SEt.L

Example :
The meter will switch the pump off when the liquid reaches the alarm maximum setpoint level SEt.H. It will only switch the pump on again when the level has dropped to a minimum setpoint SEt.L.

If the tank does not have straight sides, you can use the meter's lineariser to convert pressure to volume.

High alarm pump control

To configure the alarm type
1. Move the rear switch A to the UP position

2. Press the Alarms button repeatedly until your chosen alarm channel annunciator LED flashes. We use Alarm 2 (AL2) for this example.

3. Press and hold the Alarms button for at least 6 seconds until you see ...

digital panel meter front lens
A
C
F
g


You can now view and change the following alarm features...

Use the △ or ▽ buttons to move up or down the list and press OK when you see PC.Hi, to select this mode.


2. Colour when in alarm state
Use the △ or ▽ buttons to move up or down the list and press OK to select.

CoL.G = Green
CoL.Y = Yellow
CoL.r = Red

The highest numbered alarm channel will have the highest colour priority.

If tripped, AL2 will dominate AL1 for colour
If tripped, AL3 will dominate AL2 and AL1 for colour
If tripped, AL4 will dominate AL3, AL2 and AL1 for colour

So, if Alarm 1 has tripped and its alarm colour is Yellow, and Alarm 2 has tripped and its alarm colour is red, the display will be red.

If no alarms are active, the display colour will be the colour chosen in the Colour Setting section.

If you want visual colour cues to critical alarms, place the most critical alarms on the higher alarm channels.


3. Relay energised or de-energised when in alarm
Use the △ or ▽ buttons to move up or down the list and press OK to select.

rL.dE means the relay will de-energise when an alarm condition occurs. This is the recommended option, because it gives failsafe relay action. You will get the same condition if you lose power to meter, which is generally the safest response. On the diagram below, we show relays which de-energise on trip with a green tick.

rL.En means the relay will energise when an alarm condition occurs. This is normally not the best option, because it is not failsafe. You will never get an alarm response if you lose power to the meter, which could be dangerous, so we mark this response with a red cross.


4. Source of comparison data
You can choose which available data within the meter is compared to each alarm setpoint.

nEtt
Only the Nett value will be compared with this alarm setpoint.

GroS
Only the Gross value will be compared with this alarm setpoint.

PEA.G
Only the Peak (maximum) Gross value will be compared with this alarm setpoint.

VAL.G
Only the Valley (minimum) Gross value will be compared with this alarm setpoint.

PEA.n
Only the Peak (maximum) Nett value will be compared with this alarm setpoint.

VAL.n
Only the Valley (minimum) Nett value will be compared with this alarm setpoint.

tARE
Only the Tare value will be compared with this alarm setpoint.

CJ t
Only the ambient temperature sensor value will be compared with this alarm setpoint.


5. Set.H and SEt.L
These are the values which the measurement will be compared to. You can edit them using the Digit button to select each digit, and the △ or ▽ buttons to increase or decrease the value of a digit.

To set a negative setpoint, use the Digit button to select the left-hand digit and press the ▽ button to show the negative symbol. eg. -XXX.XX.

High Alarm relay pump control action


7. On.tr
This sets a delay, before which the alarm relay will trip, when an alarm condition occurs. You can set it from 00.0 to 99.9 seconds.

on delay before trip

It is useful if your measurement has noise or transient alarm conditions and you do not want brief false alarms.

It requires that the alarm condition remains present for the whole  On.tr  period, before the alarm output will change.

If your trip has this delay set, and an alarm condition occurs, you will see that the alarm annunciator LED will first turn yellow, to indicate that the trip condition has been triggered.

Then after the delay period has passed, the alarm relay will trip and the annunciator LED will turn red.


8. t.out
This sets a timed pulse output duration on your alarm relay. You can set it from 00.0 to 99.9 seconds.

off delay before trip, fixed duration, repeat

You would normally use this setting and On.tr. If you set On.tr to 01.0 and set t.Out to 05.0, the alarm will activate after 1 second, will remain active for 5 seconds, then be inactive for 1 second, active for 5 and so on, for the duration that the alarm is present. The annunciator LED will be yellow during inactive alarm relay periods and red when the alarm relay is active.

If you alarm mode is PuL.H or PuL.L, then you will only get one pulse, whose duration is set by t.Out and it may be delayed by a period set in On.tr. The alarm condition must exist for longer than On.tr for the relay to change state.

off delay before trip


9. OFF.t
This sets a delay, before which the alarm relay will reset, when coming out of an alarm condition. You can set it from 00.0 to 99.9 seconds.

off delay after trip

If your trip has this delay set, and an alarm condition ends, then after the delay period has passed, the alarm relay will reset and the red annunciator LED will turn off.


We are here to help you!

We can help you!

Your question or comment


Your name


Your email address


Our privacy statement
Form Index: 31


Pump Control Low Alarm mode

print


Creates an alarm if the input signal reaches or goes below a setpoint SEt.L. Resets the alarm if the input signal reaches or goes above a maximum setpoint SEt.H

Example :
The meter will switch the pump off when the liquid reaches the alarm minimum setpoint level SEt.L. It will only switch the pump on again when the level has risen to a maximum setpoint SEt.H.

If the tank does not have straight sides, you can use the meter's lineariser to convert pressure to volume.

Low alarm pump control

To configure the alarm type
1. Unlock the alarms menu

2. Press the Alarms button repeatedly until your chosen alarm channel annunciator LED flashes. We use Alarm 2 (AL2) for this example.

3. Press and hold the Alarms button for at least 6 seconds until you see ...

digital panel meter front lens
A
C
F
g


You can now view and change the following alarm features...

Use the △ or ▽ buttons to move up or down the list and press OK when you see PC.Lo, to select this mode.


2. Colour when in alarm state
Use the △ or ▽ buttons to move up or down the list and press OK to select.

CoL.G = Green
CoL.Y = Yellow
CoL.r = Red

The highest numbered alarm channel will have the highest colour priority.

If tripped, AL2 will dominate AL1 for colour
If tripped, AL3 will dominate AL2 and AL1 for colour
If tripped, AL4 will dominate AL3, AL2 and AL1 for colour

So, if Alarm 1 has tripped and its alarm colour is Yellow, and Alarm 2 has tripped and its alarm colour is red, the display will be red.

If no alarms are active, the display colour will be the colour chosen in the Colour Setting section.

If you want visual colour cues to critical alarms, place the most critical alarms on the higher alarm channels.


3. Relay energised or de-energised when in alarm
Use the △ or ▽ buttons to move up or down the list and press OK to select.

rL.dE means the relay will de-energise when an alarm condition occurs. This is the recommended option, because it gives failsafe relay action. You will get the same condition if you lose power to meter, which is generally the safest response. On the diagram below, we show relays which de-energise on trip with a green tick.

rL.En means the relay will energise when an alarm condition occurs. This is normally not the best option, because it is not failsafe. You will never get an alarm response if you lose power to the meter, which could be dangerous, so we mark this response with a red cross.


4. Source of comparison data
You can choose which available data within the meter is compared to each alarm setpoint.

nEtt
Only the Nett value will be compared with this alarm setpoint.

GroS
Only the Gross value will be compared with this alarm setpoint.

PEA.G
Only the Peak (maximum) Gross value will be compared with this alarm setpoint.

VAL.G
Only the Valley (minimum) Gross value will be compared with this alarm setpoint.

PEA.n
Only the Peak (maximum) Nett value will be compared with this alarm setpoint.

VAL.n
Only the Valley (minimum) Nett value will be compared with this alarm setpoint.

tARE
Only the Tare value will be compared with this alarm setpoint.

CJ t
Only the ambient temperature sensor value will be compared with this alarm setpoint.


5. Set.H and SEt.L
These are the values which the measurement will be compared to. You can edit them using the Digit button to select each digit, and the △ or ▽ buttons to increase or decrease the value of a digit.

To set a negative setpoint, use the Digit button to select the left-hand digit and press the ▽ button to show the negative symbol. eg. -XXX.XX.

Low Alarm relay pump control action


7. On.tr
This sets a delay, before which the alarm relay will trip, when an alarm condition occurs. You can set it from 00.0 to 99.9 seconds.

on delay before trip low

It is useful if your measurement has noise or transient alarm conditions and you do not want brief false alarms.

It requires that the alarm condition remains present for the whole  On.tr  period, before the alarm output will change.

If your trip has this delay set, and an alarm condition occurs, you will see that the alarm annunciator LED will first turn yellow, to indicate that the trip condition has been triggered.

Then after the delay period has passed, the alarm relay will trip and the annunciator LED will turn red.


8. t.out
This sets a timed pulse output on your alarm relay. You can set the duration from 00.0 to 99.9 seconds.

off delay before trip, fixed duration, repeat

You would normally use this setting and On.tr.

Example:
Set On.tr = 01.0
Set t.Out = 05.0
The alarm will activate after 1 second, will remain active for 5 seconds, then be inactive for 1 second, active for 5 and so on, for the duration that the alarm is present.

The annunciator LED will be yellow during inactive alarm relay periods and red when the alarm relay is active.

If your alarm mode is PuL.H or PuL.L, then you will only get one pulse, whose duration is set by t.Out and it may be delayed by a period set in On.tr. The alarm condition must exist for longer than On.tr for the relay to change state.

off delay before trip


9. OFF.t
This sets a delay, before which the alarm relay will reset, when coming out of an alarm condition. You can set it from 00.0 to 99.9 seconds.

off delay after trip low

If your trip has this delay set, and an alarm condition ends, then after the delay period has passed, the alarm relay will reset and the red annunciator LED will turn off.


further information This video demonstrates how to set up a Low Pump Control Alarm for alarm channel 2.


Quick and Easy


We are here to help you!

We can help you!

Your question or comment


Your name


Your email address


Our privacy statement
Form Index: 32


Front Service Data Port

print

The front service data port is found behind the meter's front lens.

Front data port of digital panel meter

To remove the lens, look under the lower surface of the bezel. You will see 2 rectangular slots. Push a 4mm screwdriver into each slot and ease the lens forward to release it.

How to remove the front lens from a digital panel meter

This port is used with our USB Isolator Module, shown below.

You can connect your meter to your PC USB port and the isolator module will give galvanic isolation.

You can use the front PC port to :-

1. Copy settings from one meter to another
2. Get detailed meter diagnostics
3. Enable some physical installations


digital panel meter usb connection isolator

[1] = USB connection OK
[2] = Port connection OK
[3] = Reset Meter
[4] = Receiving data
[5] = Sending data


We are here to help you!

We can help you!

Your question or comment


Your name


Your email address


Our privacy statement
Form Index: 33


RS232 or RS485 Serial Data Ports

print

You can have 0, 1 or 2 data ports. You can configure each of them differently.

For example data port 1 could be RS232 at 9600 baud, sending the meter's reading in ASCII format.

Data port 2 could be RS485 at 115200 baud, giving the meter's ambient temperature in modbus RTU format.

Example: 2 x RS232 outputs:
RS232 output connections

Example: 2 x RS outputs:
RS485 output connections

You can choose from several data sources.


How to configure the serial data ports.

Unlock the calibration menu

1. Press buttons 2 and 4 together for at least 6 seconds.

The display will show Channel 1,   dAt.1

If there are 2 data ports installed, you can now press the △ button to select Channel 2,   dAt.2


digital panel meter front lens
d
A
t
1


  Dat.1  port fits in   'SLOT 3'  on the upper board. It connects to rear terminals 22,23 and 24

  Dat.2  port fits in   'SLOT 2'  on the upper board. It connects to rear terminals 25,26 and 27


digital panel meter front lens
d
A
t
2


To select the data port you want to configure, press   OK.

You can now set the Baud rate ...


digital panel meter front lens
b
A
U
d


Press the △ or ▽ buttons to select your baud rate.

  300 
  600 
  1200 
  2400 
  4800 
  9600 
  19200 
  38400 
  115200 

To save, press   OK. You can now set the data format...


digital panel meter front lens
d
F
N
t


Press the △ or ▽ buttons to select your data format.

 701.  = 7 data bits, Odd Parity, 1 Stop bit
 7E1.  = 7 data bits, Even Parity, 1 Stop bit
 7N2.  = 7 data bits, No Parity, 2 Stop bits
 801.  = 8 data bits, Odd Parity, 1 Stop bit
 8E1.  = 8 data bits, Even Parity, 1 Stop bit
 8N1.  = 8 data bits, No Parity, 1 Stop bit

To save, press   OK.


You can now set the data protocol.


digital panel meter front lens
P
r
C
1


Press the △ or ▽ buttons to select your protocol.

  Pr.C1.  = Continuous ASCII stream
This mode is ideal if you want to send the meter's reading to a remote display.

This mode is also available for time-based displays, such as clock, elapsed time etc.


  Pr.H1.  = 'London GPS' Receiver
This mode is used for specialised GPS time synchronisation

(not currently available when displaying time, elapsed time, clock etc)


  Pr.P1.  = Polled 'London ASCII'
This is a general purpose addressable mode, with a simple protocol

(not currently available when displaying time, elapsed time, clock etc)


  Pr.P2.  = Polled 'Modbus ASCII'
This is a simple modbus ASCII addressable mode

(not currently available when displaying time, elapsed time, clock etc)


  Pr.P3.  = Polled 'Modbus RTU'
This mode returns data in 32-bit IEEE-754 floating point format.

(not currently available when displaying time, elapsed time, clock etc)


To save, press   OK.


You can now set the data data source.


digital panel meter front lens
n
E
t
t


Press the △ or ▽ buttons to select a data source.

 Nett.  = Nett (default)
 GroS.  = Gross
 PEA.g.  = Peak of Gross
 VAL.g.  = Valley of Gross
 PEA.n.  = Peak of Nett
 VAL.n.  = Valley of Nett
 tArE.  = Tare
 CJ t.  = Temperature of cold junction

To save, press   OK.


You can now set the Start Character HEX value.


digital panel meter front lens
5
C
0
2


Press the 'Digit' and △ or ▽ buttons to select your Start character. To save, press   OK.


You can now set the End character HEX value.


digital panel meter front lens
E
C
0
3


Press the 'Digit' and △ or ▽ buttons to select your End character and press   OK  to save.


You can now set the Repeat delay, if you chose Protocol 'C1'


digital panel meter front lens
r
P
t


Press the 'Digit' and △ or ▽ buttons to set the number of seconds between each transmission.

The available range is 0.1 to 99.9 seconds.

To save, press   OK.


Data board identification and Connections

RS232

RS232 board identification...
Digital panel meter RS232 Data Port

Output connections are shown for both ports. You do not need to have both ports fitted, nor do they both need to be the same data type.

RS232 output connections


RS485

RS232 board identification...
Digital panel meter RS485 Data Port

Output connections are shown for both ports. You do not need to have both ports fitted, nor do they both need to be the same data type.

RS485 output connections


further information This video shows how to set up your serial output in P1 mode.

It also shows us using RealTerm to communicate with the meter.

Quick and Easy


Specifications

InstallationThese are plug-in modules which you can add to your meter at any time.
CombinationsAny combination of 0 or 1 extra serial outputs, 0 or 1 analogue output, 0 or 4 alarm outputs
Galvanic IsolationOptically isolated from all ports up to 250 VAC
Source of dataSelect one of these data sources:

1. Display value (default)
2. Nett Value
3. Maximum Nett Value
4. Minimum Nett Value
5. Gross Value
6. Maximum Gross Value
7. Minimum Gross Value
8. Tare Value
9. Meter temperature
Response speedUpdates up to 10 times per second, depending on chosen baud rate.
Repetition DelayCan be set 0.1 to 99.9 seconds in protocol C1
Comms typeRS232 = Full duplex
RS485 = half duplex
Baud rates300,600,1200,2400,4800
9600,19200,38400,115200
Address Range2 byte address,  01  to  FE , 254 addresses available
Data formats  701  = 7 data bits, Odd Parity, 1 Stop bit
 7E1  = 7 data bits, Even Parity, 1 Stop bit
 7N2  = 7 data bits, No Parity, 2 Stop bits
 801  = 8 data bits, Odd Parity, 1 Stop bit
 8E1  = 8 data bits, Even Parity, 1 Stop bit
 8N1  = 8 data bits, No Parity, 1 Stop bit
ASCII Output message formats Meter sends <STX> 8 characters <ETX>

Examples:

Negative value with decimal point
02 20 20 20 20 2D 31 2E 36 03 (-1.6)

Positive value with decimal point
02 20 20 20 20 20 31 2E 38 03 (+1.8)

Open circuit
02 20 20 20 20 2D 4F 43 2D 03 (-OC-)

Short circuit
02 20 20 20 20 2D 53 43 2D 03 (-SC-)

Display over range
02 20 20 64 2E 6F 2E 72 2E 03 (d.o.r.)

Display under range
02 20 20 64 2E 75 2E 72 2E 03 (d.u.r.)

Input over range
02 20 20 69 2E 6F 2E 72 2E 03 (i.o.r.)

Input under range
02 20 20 69 2E 75 2E 72 2E 03 (i.u.r.)
Protocols  C1  = Continuous to slave display, or on demand via contact closure for printer


 H1  = GPS Receiver protocol


 P1  = Polled, addressable, Responds to London messaging syntax

Request format:
<Start Char> <Addr> <Request> <End Char> 

For example:
<STX>01g<ETX>  will ask meter with address '01' to send its Gross value

In HEX, this will be  \x02\z30\x31\x67\x03 
if
 <STX> = \x02 
and if
 <ETX> = \x03 .

You can configure <STX> and <ETX> to be your own preferred HEX values.

Request identifiers:
 d (hex 64)  = displayed value
 n (hex 6E)  or  r (hex 72)  = nett
 g (hex 67)  or  R (hex 52)  = gross
 J (hex 4A)  = Junction temperature at rear of meter
 p (hex 70)  = nett peak
 P (hex 50)  = gross peak
 v (hex 76)  = nett valley
 V (hex 56)  = gross valley
 t (hex 74)  = tare value


 P2  = Polled, addressable, Responds to Modbus ASCII messaging syntax


 P3  = Polled, addressable, Responds to Modbus RTU messaging syntax

ValueRegister
Display Value0x0000
Nett0x0002
Gross0x0004
Nett Peak0x0006
Nett Valley0x0008
Gross Peak0x000A
Gross Valley0x000C

The values are provided in 32-bit IEEE-754 floating point format.


ASCII Character Table

The \x prefix shown before each HEX value is needed if you are sending or viewing HEX values through RealTerm.


To send 123.4 with RealTerm, we would enter ...

\x02\x31\x32\x33\x2E\x34\x03

HEXCharacterNotes
\x00NULNull
\x02STXStart Character
\x03ETXEnd Character
\x04EOTEnd of Transmission
\x09TABHorizontal Tab
\x0ALFLine Feed
\x0DCRCarriage Return
\x1BESCEscape
\x20Space
\x21!Exclamation
\x2B+Plus
\x2C,Comma
\x2D-Minus
\x2E.Decimal point
\x2F/Forward slash
\x300Zero
\x311One
\x322Two
\x333Three
\x344Four
\x355Five
\x366Six
\x377Seven
\x388Eight
\x399Nine
\x3A:Colon
\x3B;Semi-colon
\x3C<Less Than
\x3D=Equals
\x3E>Greater Than
\x3F?Question Mark
\x40@Ampersand
\x41A
\x42B
\x43C
\x44D
\x45E
\x46F
\x47G
\x48H
\x49I
\x4AJ
\x4BK
\x4CL
\x4DM
\x4EN
\x4FO
\x50P
\x51Q
\x52R
\x53S
\x54T
\x55U
\x56V
\x57W
\x58X
\x59Y
\x5AZ
\x5E^Caret
\x61a
\x62b
\x63c
\x64d
\x65e
\x66f
\x67g
\x68h
\x69i
\x6Aj
\x6Bk
\x6Cl
\x6Dm
\x6En
\x6Fo
\x70p
\x71q
\x72r
\x73s
\x74t
\x75u
\x76v
\x77w
\x78x
\x79y
\x7Az
\x7FDEL


We are here to help you!

We can help you!

Your question or comment


Your name


Your email address


Our privacy statement
Form Index: 34


Ambient Temperature Sensor

print

There is a temperature sensor on the rear of the meter, between the analogue input terminals and the contact closure input terminals.

It gives cold junction compensation for thermocouple measurements, but can also show the meter's ambient temperature when in another measurement mode.

This reading cannot be scaled or offset, it is a fixed internal calibration.


digital panel meter front lens
2
4
8
4


Available for alarm and retransmission:
It can be compared to an alarm setpoint, to warn if the ambient temperature is too low or too high.

Other setpoints can be used for general measurement control or alarm of the meter's main measurment.

It can be re-transmitted from one of the meter's data ports or from the analogue output.

1. Unlock the configuration menu

2. Press Buttons 3 and 4 at the same time, for 3 seconds.

3. The meter will show dISP. Then it will show the existing display parameter.

Use Button 2 or Button 3 to view the list of available display parameters, until you see CJ t

Press Button 4 repeatedly until you see the local temperature to 2 decimal places, degrees C.

It will display the meter's rear ambient temperature in degrees C, in the format  XX.XX


Specifications

Sensor typeSolid State silicon chip
Resolution0.01 deg. Centigrade
Range-20 to +60 deg. C
Accuracy+/- 0.25 Degrees C
Update Rate10 readings per second
Time constant1 minute


further information This video shows how to view the ambient temperature of your meter.

Quick and Easy


We are here to help you!

We can help you!

Your question or comment


Your name


Your email address


Our privacy statement
Form Index: 35


General Specifications

print

For detailed specifications about each input or output function, please see the individual function pages.

3D CAD .STEP files help you design your system ...

1.  3D STEP Files - all  [Case_STEP_Files.zip]
2.  3D Meter Case  [int_meter_main.STEP]
3.  3D Sealing gasket  [int_meter_gasket.STEP]
4.  3D Splashproof cover  [int_meter_cover.STEP]


digital panel meter front quarter view

digital panel meter rear quarter view

digital panel meter plan view

digital panel meter front view

digital panel meter rear view

digital panel meter side view


Case Dimensions
Frontal Area96 mm wide x 48 mm high
Cutout size92 mm wide x 45 mm high
Projection in front of panel13 mm
Projection behind panel125 mm
Max Width behind panel100 mm
Max. Weight - all options installed360 grams
Screw Terminal Connectors
Function IdentificationLabel adjacent to each connector identifies terminal number or function.
Power1 x Plug-In 3 pin colour-coded connector.
Cable exits below connector.
Use 3.2mm flat bladed terminal screw driver
Signal/ControlPlug-In Green connector
Cable exits below connector on bottom row
Cable exits above connector on top row
Use 2.4mm flat bladed terminal screw driver
Environmental
Front SealingIP65 standard, IP67 with option SPC4
Rear SealingIP20
Case MaterialPolycarbonate - Black
CleaningUse only damp cloth moistened with water.
Storage Temperature-25 to +60C
Operating Temperature-25 to +50C
Humidity10 to 95% non condensing
Altitude-1000m to + 3000m
Vibration/Shock0-5G, less than 200Hz.
Display
TechnologyTri-Colour LED
DigitsFormat is 8.:8.:8:.8.:8.:8.
Update Rate: 10 per second
Colour: Selectable Red, Yellow or Green
Digit Height: 14.2mm

Reading distance: 7 metres max.
NB We make large digit versions of this display for indoor and outdoor viewing, in many digit sizes, for viewing up to 150 metres / 450 feet away.

Brightness: 8 selectable brightness levels
Annunciators 4 x 3 colour alarm annunicators
4 x 3 colour display annunicators
1 x 3 colour lock-status annunicator
1 x text area for printed units of measure label


IP67 Optional Cover

The SPC4 option is a low cost and robust method to seal the front of all 1/8 DIN size panel meters to IP67.


SPC4 IP67 cover for 1/8 DIN digital panel meter


The SPC4 cover, installed on a digital panel meter

Example of installed SPC4 IP67 cover for 1/8 DIN digital panel meter

You can easily fit it to existing installations, or include it as a value-added accessory for new systems. The panel cutout is the standard hole size for the panel meter.

The panel area is 130mm wide x 60.6mm high.

The front window is detachable, you can adjust the panel meter during commissioning. It is held in place with two knurled captive screws.

The window and the holding frame are made from high impact material. The threaded parts are made from marine brass and are moulded securely into the frame. Flexible neoprene gaskets provide the reliable seal.

SPC4 IP67 cover for 1/8 DIN digital panel meter. Front dimensions

SPC4 IP67 cover for 1/8 DIN digital panel meter. Side dimensions


We are here to help you!

We can help you!

Your question or comment


Your name


Your email address


Our privacy statement
Form Index: 36


Permanent Display Value

print


You can set the display to permanently show one of several different sources of data.

For example, you can configure the display to permanently show the peak, or valley, or the nett value, or the gross value, or the tare value, etc.

In most measurements, the Nett value is the most appropriate, so this is the default.

Unlock the calibration menu, select Ed.CF

Press Button 3 and Button 4 together for 3 seconds. The  dISP promp will appear.

You can use the △ or ▽ buttons to set one of the following permanent display values. Press 'OK' to save :


 Nett The Nett value
This is the value after you tare the display.

For example, if the meter reading shows 12.5 and you tare it, the display will show 0.0
This is the most common display choice in most weighing applications.


 Gros The Gross Value
This is the amount the measurement has risen by since it was calibrated at 0.

The displayed value will not change if you tare the meter.

This is common in applications where you want to see the total amount of some measurement, such as silo content.


 PEA.G The Peak Gross value
This value will track the rising gross value and will remain at the highest level, since it was last reset.

This is useful in such applications as over-temperature monitoring, flood level monitoring, mechanical overload / destructive test monitoring.


 VAL.G The Valley Gross Value
This value will track the falling gross value and will remain at the lowest level, since it was last reset.

This is useful in such applications as under-temperature monitoring, storage container depletion monitoring, minimum ground-water level detection etc.


 PEA.n The Peak Nett value
This shows the highest Nett value since the peak was last reset.


 VAL.n The Valley Nett value
This shows the lowest Nett value since the valley was last reset.


 tArE The Tare value
This shows the tare amount.

For example, in a weighing application, your platform has nothing on it and reads 0

You place an empty container weighing 78kg on the platform and the display reads 78.

You tare the display to 0, ready to weigh how much material you put in the container.

The Tare value will remain at 78kg, even while you fill or empty the container.


 CJ.t The Cold Junction Temperature
There is a temperature sensor on the rear of the meter which compensates for thermocouple cable ambient temperature errors.

You can display this temperature permanently, if you want to show the temperature inside the enclosure.

The meter can continue its main measurement / control function in the background.


 P.Frq The Power Frequency
If you meter is AC powered and includes the Power Frequency monitoring option, you can set the display to show power frequency, while the rest of the meter monitors and reacts to the main measurment input signal, which could be temperature, speed, total etc.


We are here to help you!

We can help you!

Your question or comment


Your name


Your email address


Our privacy statement
Form Index: 37


Active Digits: 4 or 6

print

You can choose to have 4 or 6 digits active on this display.

Unlock the calibration menu

1. Press Buttons 3 and 4 together for at least 3 seconds.


2. Press OK repeatedly until you see ...

digital panel meter front lens
d
i
g
6


or...

digital panel meter front lens
d
i
g
4


3. Press the △ or ▽ button repeatedly until you see the meter type you want.

4. Press OK to save your choice and to see the next menu option.

Always choose dig6 for the 1/8 DIN panel meter version.


We are here to help you!

We can help you!

Your question or comment


Your name


Your email address


Our privacy statement
Form Index: 38


Mean Time Before Failure

print

High temperature is the main enemy of electronic devices.

This is because electrolytic capacitors, which are the components most likely to fail, age faster at higher temperature.

For best reliability, operate your displays in an environment where the temperature around the meter is less than 50C, ideally between 10 to 30C.

When you install the meter in a cabinet, the internal temperature may be many degrees higher than the temperature outside the cabinet.

We have calculated worst case MTBF when all possible options are installed in the meter, all operating at maximum power dissipation.

This means all relays energised, analogue output feeding into a Zero-Ohm load, excitation supply fully loaded to its rated current capacity, RS485 ports transmitting at high baud rate into 32 loads to

Figures are for altitude less than 2500 m. Higher altitude has lower air density with less air-cooling capacity.

Water vapour condensation is not included in these calculations due to its often unpredictable effect.

The installation must be designed to prevent water condensation inside the meters.

MTBF
ReliabilityFigures at 50% rh.
All options installed in meter


Effect of Ambient Temperature on MTBF:

Temp.  Hours  Years
0 oC   92 000    10.5
10 oC   95 000    10.8
20 oC   95 000    10.8
30 oC   92 000    10.5
40 oC   90 000    10.2
55 oC   85 000    9.7


Useful Diagnostic Feature:

This meter has an on-board ambient temperature sensor. To see the ambient temperature around the meter at any time, please see [PCB Temperature display].


Stabilisation

print


stabilisation

This function helps you to stabilise a reading which is moving because of input signal fluctuations.

The more stabilisation you add, the slower will be the display's response, so some compromise is required between stability and speed.

Unlock the configuration menu

Press Buttons 2 and 3 together for 3 seconds.

Press OK repeatedly, until you see  F00.0 or similar.

You can edit the stability function value from  F00.0  to  F99.9  seconds.

A value of  F05.0,  for example, will average the reading over a 5 second period, updating every 0.1 second.

If you make a step change to the input with  F05.0,  the display will ramp linearly to the new value, taking 5 seconds to reach it.

Use the smallest value which provides sufficient stability.

Press OK repeatedly to return to the normal display mode.

further information This video demonstrates how to adjust the stabilisation.

Compare the stability of the display before and after the adjustment.


Quick and Easy


We are here to help you!

We can help you!

Your question or comment


Your name


Your email address


Our privacy statement
Form Index: 39


Count by 1, 2, 5, 10, 20 or 50

print


In some applications, you may prefer your digital display to resolve to the nearest 2, 5, 10, 20 or 50 counts.

For example, on a weigh bridge, showing 0-10 000 kg, you may wish to display to the nearest 10 kg.

It is easy to change.

First, unlock the configuration menu.

Press Button 2 and Button 3 at the same time, for 3 seconds.

Repeatedly Press OK. Stop whe you see L.d. x.

Use Button 2 to increase the value of x or Button 3 to decrease it, until it shows 10, or your preferred rounding value.

To save your choice, press OK.

further information This video demonstrates how to change the count-by resolution, with several examples with 10 000 kg load on a weighing platform.


Quick and Easy


We are here to help you!

We can help you!

Your question or comment


Your name


Your email address


Our privacy statement
Form Index: 40


Bootup mode

print

You can choose what happens on the display when you first switch on the meter.

There are 5 power-on or bootup modes available:-

Bootup Modes

bt. 0 = Meter immediately displays measurement data.
(Recommended mode)

bt. 1 = Meter does a display test, then displays measurement data.

bt. 2 = Meter does a display test, reports measurement mode, then displays measurement data.

bt. 3 = Meter does a display test, reports full inventory of measurement mode and all installed options, then displays measurement data.

bt. 4 = Meter does a display test, and remains fixed with all segments lit (display burn-in test), until you press a button, then displays measurement data.


We recommend you to use bt. 0 normally.
You can view your meter's full inventory at any time.
See [ Inventory ]


How to change the bootup mode:

1. If the meter is locked, unlock the calibration menu

2. Press Button 3 and Button 4 together for 3 seconds until the display changes.


3. Press the 'OK' button until you see 'bt. X' where X is a number from 0 to 4

4. Press the △ or ▽ button repeatedly until you see the bootup mode you want, and press 'OK'


The meter will lock itself automatically within 5 minutes, or immediately, if you switch the meter off then on again.


We are here to help you!

We can help you!

Your question or comment


Your name


Your email address


Our privacy statement
Form Index: 41


Offest - Add or Subtract a fixed amount

print


In some applications, you may want to add or subtract a fixed amount from all readings. For example, in weighing applications, if 17kg of new equipment is added to a calibrated hopper, you may wish to subtract 17kg for all readings.

Unlock the configuration menu

Press Button 2 and Button 3 at the same time, for 3 seconds.

Repeatedly press OK. Stop when you see OF.St

Select each digit you want to edit, with Digit. Use Button 2 to increase the value or Button 3 to decrease it.

To save your choice, press OK.

further information This video demonstrates how to change the offset, with two examples.

Our basic calibration is 0.00 to 5.00 kg

First we will add a positive offset of 2.00

Then we will subtract an offset of 1.70

Quick and Easy


We are here to help you!

We can help you!

Your question or comment


Your name


Your email address


Our privacy statement
Form Index: 42


Scale Factor: Multiply or Divide

print


You can multiply or divide all readings by an amount which you can adjust.

Normally it is set to multiply by 1.000

It can be useful if you want to make fine adjustments to your readings or to change from S.I. to imperial or other units.

If you want to change your kg or pounds display to show or to show tons, bushels, cubic metres etc, it is simple to do so, without re-calibrating the system.


Unlock the configuration menu

Press Button 2 and Button 3 at the same time for 3 seconds.

Press OK repeatedly until you see SCAL

Use button 2 or 3 to choose Multiply or Divide.

To save your choice, press OK

Use Button 1 to move from digit to digit.

Use Button 2 to increase the scale value or Button 3 to decrease a digit.

At this point, you can change the decimal point position. To do this, press Button 2 for at least 3 seconds. You will see all decimal points illuminate, with one brighter than the others. Press button 2 or Button 3 to move the brightest decimal point where you want it.

To save your choice, press OK

You can continue to edit the numeric value.

Press OK to save your choice, when complete.

further information This video demonstrates how to change the scaling.

The first example will show how to multiply by 2.000

The second example will show how to divide by 2.000.

Quick and Easy


We are here to help you!

We can help you!

Your question or comment


Your name


Your email address


Our privacy statement
Form Index: 43


Automatic Drift Cancelling

print


Drift cancelling is useful if your display reads 0 most of the time.

This is common in weighing applications, destructive test force applications etc.

Temperature changes can cause drift in the sensor and display.

While the display is near 0, we regularly check the reading. If it drifts by a small amount which you can define, in a certain time which you can define, we will reset the display to 0.

Unlock the configuration menu

Press Button 3 and Button 4 together for 3 seconds.

Press OK repeatedly, until you see drF.x

Press button 2 to change the display to drF.1

To define the maximum amount of drift you will accept, edit drF.A

To define how often you will check for drift, in seconds, edit drF.t

Press OK repeatedly to return to the normal display mode.

Then move the lockout switch ON to activate the automatic drift correction.

further information This video demonstrates how to adjust the automatic drift cancellation.

In this example, we will accept up to 5 counts of drift, and we check for drift every 10 seconds.

Any drift up to and including 5 counts will be automatically re-set to 0.

Any movement greater than 5 counts within 10 seconds will be considered as a valid process change and will not be re-set.

When you have finished, you must move the rear calibration lockout switch to ON, to allow the drift correction to function.

The video shows several corrections and it demonstrates that a process change larger than 5 counts is not affected.

Quick and Easy


We are here to help you!

We can help you!

Your question or comment


Your name


Your email address


Our privacy statement
Form Index: 44


Useful Features

print


Display Hold

The configuration lock switch must be down (ON) to enable the logic inputs.

You can configure any of the contact closure logic ports to behave as a HOLD or FREEZE command.

While the contact is closed, the last valid reading remains on the display and any alarm states, or analogue output levels will remain constant.

As soon as you open the contact, the display will refresh with the most recent measurement and all outputs will respond to changes to input signal.

See the Contact Closure signal page for details.

further information This video demonstrates the display hold (freeze) feature.

In this example, we add it to contact closure input 2


Quick and Easy


Tare

The configuration lock switch must be down (ON) to enable the logic inputs.

You can tare the display at any time with a brief contact closure.
When you tare the display, we store the value of the display at the moment you close the tare contact. We then subtract that value from all further readings.

This is useful in applications such as weighing, where you place an empty container of unknown weight on the scales.

Tare the display, which will now show 0. Any added weight will accurately show on the display.

Taring can be used for any physical measurement where you want to set a 0 reference point and measure change from that point.

You can configure any of the contact closure logic ports to behave as a TARE command.

Each time you close the tare contact, the display will zero and will now be considered to be a nett value.

See the Contact Closure signal page for details.

further information This video demonstrates the Tare feature.

In this example, we add it to contact closure input 2


Quick and Easy


Reset

The configuration lock switch must be down (ON) to enable the logic inputs.

You can configure any of the contact closure logic ports to behave as a RESET command.

See the Contact Closure signal page for details.

further information This video demonstrates the Reset feature.

In this example, we add it to contact closure input 2


Quick and Easy


Show Peak

The configuration lock switch must be down (ON) to enable the logic inputs.

You can configure any of the contact closure logic ports to behave as a PEAK (maximum) command.

As soon as you close the PEAK contact, the display will thereafter track and display the highest value since you made the PEAK command.

The PV LED will illuminate yellow, to confirm you are viewing the PEAK value

You can permanently connect the PEAK logic line to Common, so the meter will always act as a peak display.

To clear the PEAK value, RESET the display.

See the Contact Closure signal page for details.

further information This video demonstrates the display Peak feature.

In this example, we add it to contact closure input 2


Quick and Easy


Show Valley

The configuration lock switch must be down (ON) to enable the logic inputs.

You can configure any of the contact closure logic ports to behave as a VALLEY (minimum) command.

As soon as you close the VALLEY contact, the display will thereafter track and display the lowest value since you made the VALLEY command.

The PV LED will illuminate green, to confirm you are viewing the VALLEY value

You can permanently connect the VALLEY logic line to Common, so the meter will always act as a Valley display.

To clear the VALLEY value, RESET the display.

See the Contact Closure signal page for details.

further information This video demonstrates the display Valley feature.

In this example, we add it to contact closure input 2


Quick and Easy


Show Nett

The configuration lock switch must be down (ON) to enable the logic inputs.

You can configure any of the contact closure logic ports to behave as a Nett display command.

As soon as you close the Nett contact briefly, the display will thereafter track and display the Nett value.

To display a different value, use a different logic command.

See the Contact Closure signal page for details.

further information This video demonstrates the display Show Nett feature.

In this example, we add it to contact closure input 2


Quick and Easy


Show Gross

The configuration lock switch must be down (ON) to enable the logic inputs.

You can configure any of the contact closure logic ports to behave as a Gross display command.

As soon as you close the Gross contact briefly, the display will thereafter track and display the Gross value.

To display a different value, use a different logic command.

See the Contact Closure signal page for details.

further information This video demonstrates the display Show Gross feature.

In this example, we add it to contact closure input 2


Quick and Easy


Heads-Up format

The configuration lock switch must be down (ON) to enable the logic inputs.

You can configure any of the contact closure logic ports to behave as a Heads-Up display command.

While the Heads Up logic port is closed, the display with be a mirror image of normal.

If you view a reflection of the display, for example through a heads-up window, it will appear legible.

further information This video demonstrates the display Heads-Up feature.

In this example, we add it to contact closure input 2


Quick and Easy


We are here to help you!

We can help you!

Your question or comment


Your name


Your email address


Our privacy statement
Form Index: 45


Certifications

print


EU and UK Declaration of Conformity


CE Certification mark

UKCA Certification mark


We hereby self-certify that the design and manufacture of this product conforms with the UKCA and CE standards, by complying with the directives and standards below.

Electrical Equipment (Safety) Regulations, 2016 and amendments
Low Voltage Directive 2014/35/EU
BS EN 61010-1 : 2010 + A1 : 2019


Electromagnetic Compatibility Regulations, 2016 and amendments
EMC Directive 2014/30/EU
EN 61326-1 : 2013
Immunity for equipment intended to be used in an industrial electromagnetic environment.

Maximum errors of 1% of dynamic range are permitted.
Instrument must recover automatically from disturbance.


Restriction of the Use of Certain Hazardous Substances in Electrical and Electronic Equipment Regulations, 2012 and amendments
RoHS2 directive incorporating RoHS3 Amendment 2015/863/EU
EN IEC 63000 : 2018


Declaration date : 13 September 2022


Signed:  James R Lees, Managing Director


Click to download certificate:
UL ISO9001 Certificate


Patent Certificate for digital panel meter signal processing method


We are here to help you!

We can help you!

Your question or comment


Your name


Your email address


Our privacy statement
Form Index: 46


Warranty

print

We warrant this product against manfacturing defects for 3 years from the purchase date.

If you find a defect in that period, return the unit to the Distributor from where you bought it. You must pay any carriage charges.

The Distributor will choose to repair or replace the unit. The unit will be returned to you with freight charges paid by the distributor, if it is covered by warranty. If it is not covered by warranty, you must pay the carriage charges.

LIMITATION OF WARRANTY
The warranty does not cover the following defects:
1. Improper maintenance by the buyer/user.
2. Unauthorised modification.
3. Operation outside the environmental specification of the product.
4. Mishandling, misuse or abuse.

This warranty is exclusive. No other warranty, whether written or oral is expressed or implied. We specifically disclaim any implied warranties of merchantability and fitness for a particular purpose.

EXCLUSIVE REMEDIES
These are the buyer's only remedies.

We will not be liable for direct, indirect, incidental or consequential damages (including loss of profits) whether based on contract, tort or any other legal theory.

If this device is vital to your system, keep a spare in stock. We cannot guarantee speed of repair or replacement.


Mean Time Before Failure

Temperature is the main enemy of electronics reliability.

This is because electrolytic capacitors, which are the components most likely to fail, age faster at higher temperature.

For best reliability, operate your displays in an environment where the temperature around the meter is less than 50C, ideally between 10 to 30C.

When you install the meter in a cabinet, the internal temperature may be many degrees higher than the temperature outside the cabinet.

We have calculated worst case MTBF when all possible options are installed in the meter, all operating at maximum power dissipation.

This means all relays energised, analogue output feeding into a Zero-Ohm load, excitation supply fully loaded to its rated current capacity, RS485 ports transmitting at high baud rate into 32 loads to

Figures are for altitude less than 2500 m. Higher altitude has lower air density with less air-cooling capacity.

Water vapour condensation is not included in these calculations due to its often unpredictable effect.

The installation must be designed to prevent water condensation inside the meters.

MTBF
ReliabilityFigures at 50% rh.
All options installed in meter


Effect of Ambient Temperature on MTBF:

Temp.  Hours  Years
0 oC   92 000    10.5
10 oC   95 000    10.8
20 oC   95 000    10.8
30 oC   92 000    10.5
40 oC   90 000    10.2
55 oC   85 000    9.7


Useful Diagnostic Feature:

This meter has an on-board ambient temperature sensor. To see the ambient temperature around the meter at any time, please see [PCB Temperature display].


We are here to help you!

We can help you!

Your question or comment


Your name


Your email address


Our privacy statement
Form Index: 47


49 videos on this site


Units of Measure Labels

print

We supply a selection of common labels with your INT5 meter, so you can identify what the reading means.

Units of Measure labels for digital panel meter

You can download and print off a correctly scaled copy [here].

If you need something different, we have made an online label creator tool for you.

Just enter the text you want in the top box and it will create a sheet of 50 correctly sized labels for you to print. See [here]


We are here to help you!

We can help you!

Your question or comment


Your name


Your email address


Our privacy statement
Form Index: 48


View the Inventory Report

print

The Inventory report shows the meter's hardware and software status.

It includes input mode, board temperature, firmware version, firmware build number and most installed option boards.

It does not report alarm relay type or whether the power frequency option is installed.

You do not need to unlock the meter to view the inventory report.

How to view the inventory

Press buttons 1 and 4 together for 3 seconds.


The display will briefly show a sequence of values and will then return to normal display mode.

All signal processing, analogue output, communications and alarm outputs continue normally in the background while you view the inventory.

  • Input Mode (Example 4-20)
  • Ambient Temperature of meter (Example 27.4c)
  • Firmware version (Example F:0.04)
  • Firmware build number (Example b.008)
  • Analogue output option (Example ANV)
  • Data port 1 option (Example 1:485)
  • Data port 2 option (Example 2:232)
  • Real time clock option (Example rtc)
Empty options are not reported.
For example, if the meter has no analogue output, data ports nor real time clock option fitted, only the first 4 lines of the report will appear.

If you contact us for support, please have your meter's inventory report available.


We are here to help you!

We can help you!

Your question or comment


Your name


Your email address


Our privacy statement
Form Index: 49


Fault Finding

print

1. Display is reading the wrong value.

The display can be set to show several different sources of data, not only from the real-time input signal.

For example, you can configure the display to show only the peak reading, or valley reading, or the meter's ambient temperature, or the nett value, or the gross value, or the tare value, etc.

In most measurements, the Nett value is the most appropriate, but check that the 'dISP' value is appropriate for your application.

[ Detailed Information ]

Unlock the calibration menu, select Ed.CF

Press Button 3 and Button 4 together for 3 seconds.

The  dISP value would normally be set to  Nett , but you can set it to any of the available options to best suit your application.


2. I cannot unlock my meter.

To unlock the meter, the display must be in normal running mode.

You can not unlock the meter while you are viewing alarm information.

Check that you have not accidentally pressed the 'Alarms' button before you try to unlock the meter.

If you are viewing alarms, one of the square LEDs marked AL1, AL2, AL3 or AL4 will be flashing yellow.

Press the 'Alarms' button repeatedly to return to normal viewing and try again.


3. The rear contact closure inputs are not working.

Possible reason 1:
The Tare, Reset, peak/valley, nett/gross contact closure inputs only function when the meter is locked.

If you have just been configuring your meter, it will remain unlocked for 5 minutes, then will automatically lock.

If you want to lock the meter immediately, switch it off, wait 5 seconds, then switch it on again.

Your contact closure inputs should then function correctly.

Possible reason 2:
If you use switches with silver-plated contacts, these can fail open-circuit due to tarnishing of the contact surfaces, especially in atmospheres containing sulphur compounds.

For all low-level signal switching applications, we recommend gold plated contacts, which remain functional in sulphurous atmospheres, and are ideal for switching low level signals.


4. I cannot reset my peak or valley display value.

To reset peak or valley, the meter must be locked and you must be viewing the normal display value.

If you want to reset using the front reset button, and you have enabled it to be active, press it for 3 seconds.

If you want to reset using the rear reset contact closure, and you have enabled it to be active, close it for 3 seconds.


5. I don't know how to lock my meter.

To lock the meter quickly, switch it off, wait 5 seconds, then switch it on again.

The meter will always be locked when you switch it on.

If you forget to switch it off and on, it will automatically lock itself 5 minutes after you make your last adjustment to a setting in the meter.

You can easily tell if your meter is locked - look at the the unlock icon. The LED it points to will be permanently unlit.


What do the LED texts mean?

If you see something on your display, which you don't recognise, this list of references may help: (work in progress)

LegendDescription
19.2 19200 baud
38.4 38400 baud
115.2 115200 baud
300 300 baud
600 600 baud
1200 1200 baud
2400 2400 baud
4800 4800 baud
9600 9600 baud
°C Degrees Centigrade / Celcius readout, when thermocouple or PT100 sensor is used.
°F Degrees Fahrenheit readout, when thermocouple or PT100 sensor is used.
°K Degrees Kelvin readout, when thermocouple or PT100 sensor is used.
°r Degrees Rankine readout, when thermocouple or PT100 sensor is used.
0-20 0-20mA input
0.1° 0.1 degree Resolution of display, when thermocouple or PT100 sensor is used.
1 degree Resolution of display, when thermocouple or PT100 sensor is used.
10_u 10V input
100r 100 Ohm range
10r 10 Ohm range
10th 10000 Ohm range
12Hr 12 Hour clock format
1r 1 Ohm range
1th 1000 Ohm range
20th 20000 Ohm range
24Hr 24 Hour clock format
4-20 4-20mA input
7E1 7 data bits Even parity 1 stop bit
8E1 8 data bits Even parity 1 stop bit
7n2 7 data bits No parity 2 stop bits
7o1 7 data bits Odd parity 1 stop bit
8n1 8 data bits No parity 1 stop bit
8o1 8 data bits Odd parity 1 stop bit
A.CFG Alarm Configuration
Ad_0 Address 0 port, for multi page memory
Ad_1 Address 1 port, for multi page memory
Ad.__ Address You can set an address from 00 to FF
AdC_ ADC value, show on display
Auto Automatic cold junction compensation for thermocouple inputs.
bAud Baud rate
biP Bipolar signal
bn.__ Bin number Used in averaging of pulsed production rate. Sets a number of bins to be averaged. Each bin has as a defined open-time during which pulses can be entered into it.
C.Src Calibration source
CC_1 Contact Closure input 1
CC_2 Contact Closure input 2
CC_3 Contact Closure input 3
CC_4 Contact Closure input 4
CC_5 Contact Closure input 5
CC_6 Contact Closure input 6
CJ t Cold Junction Temperature.
CJ-- Fixed cold junction compensation with definable temperature, for thermocouple inputs.
CL Clock function
Cnt_ Count
CoL.G Allows setting of display colour to Green
CoL.r Allows setting of display colour to Red
CoL.Y Allows setting of display colour to Yellow
d.FNt Data format. When you see this, you will have the otion to select one of several data fomats
d.o.r. Display Over Range. The positive number being sent to the display has more digits than the display.
d.tAr Display Tare
d.u.r. Display Under Range. The negative number being sent to the display has more digits than the display.
dAt.1 Data Port 1
dAt.2 Data Port 2
dbnc Debounce filter for contact closure input, set in milliseconds. Prevents multiple input pulses from being processed, when only 1 was intended.
dEF.n Defaults - No? Do you NOT want to set the meter to its factory defaults? Press OK if you do NOT want to set factory defaults.
dEF.Y Defaults - Yes? Do you want to set the meter to its factory defaults? Press OK if you do.
dig.4 Used to set the meter with a 4 digit format. Normally only used if you have a 4 digit large display version.
dig.6 Used to set the meter with a 6 digit format.
dir_ Direct Calibration You must apply signals to the meter and set the required display value for each signal level you apply.
DiSP Display Lets you choose which parameter to show on the display, by default.
dIU Division This is the Scale factor choice. For example, if the scale factor is 3 and you chose DIV, all readings will be divided by 3
dn Counter mode = Down (total decreases)
drF.0 Drift Cancellation turned off
drF.1 Drift cancellation turned on
drF.A Drift cancellation Amount threshold.
drF.t Drift cancellation sampling time interval.
dSt Daylight saving time compensation choices.
dt.__ Date (day). Used when setting the calendar.
Now it is date  21
E.CC.n External contact closures define - Yes?
E.CC.Y External contact closures define - No?
Ec.__ End Character You can set a HEX end character for a data stream. For example 03=ETX
ELAP Elapsed timer. Count up or count down
Err Error
EU European daylight saving calendar.
Fbr.0 Front Button Reset (button3) - disabled
Fbr.1 Front Button Reset (button3) - enabled
Fbt.0 Front Button Tare (button1) - disabled
Fbt.1 Front Button Tare (button1) - enabled
FL.H.A In-Flight High alarm - Automatic in-flight value.
FL.Hi In-Flight High alarm - manual in-flight value.
FL.L.A In-Flight Low alarm - Automatic in-flight value.
FL.Lo In-Flight Low alarm - manual in-flight value.
FLgt Flight correction. Allows you to set an in-flight amount to compensate for falling material which will add to your container weight, after you shut off feed to the container being filled.
Fr.in Frequency In. Used for rate meter scaling.
gATE Contact closure - Timer Gate
Gros Gross value, show on display
HH.NN Timer mode: counts in hours and minutes HH:MM.
Hi High Alarm The alarm state will occur if the measured value exceeds the setpoint value.
H.N.S Timer mode: hours minutes and seconds HH:MM:SS
Hold Contact closure mode is Hold (freeze) display and outputs.
HYSt Hysteresis. Sets a numeric amount by which the signal must return into a non-alarm zone, before the alarm output will reset. Helps to prevent relay chatter.
i.o.r. Input Over Range. The positive signal being sent to the input terminals is larger than the meter can accept.
i.u.r. Input Under Range. The negative signal being sent to the input terminals is larger than the meter can accept.
In.__ Lineariser Input signal level identifier. From In.01 to In.32
In.b In Band alarm. Will cause the alarm relay to trip if the measurement falls within upper and lower band limits.
InHi In High. Lets you define the highest value of an input signal range.
InLo In Low. Lets you define the lowest value of an input signal range.
L.cEL Load Cell
L.d._1 Last digit will count/increment by 1 least significant digit. Example 128, 129, 130, 131 etc.
L.d._2 Last digit will count/increment by 2 least significant digits. Example 128, 130, 132, 134 etc.
L.d._5 Last digit will count/increment by 5 least significant digits. Example 125, 130, 135, 140 etc.
L.d.10 Last digit will count/increment by 10 least significant digits. Example 120, 130, 140, 150 etc.
L.d.20 Last digit will count/increment by 20 least significant digits. Example 120, 140, 160, 180 etc.
L.d.50 Last digit will count/increment by 50 least significant digits. Example 100, 150, 200, 250 etc.
LAt.H Latching Ligh alarm
LAt.L Latching Low alarm
Lin.0 Lineariser is switched OFF. This is a user defined set of between 3 and 31 calibration points, to compensate for sensor or system non-linearity.
Lin.1 Lineariser is switched ON. This is a user defined set of between 3 and 31 calibration points, to compensate for sensor or system non-linearity.
Lo Low Alarm The alarm state will occur if the measured value goes below the setpoint value.
LoAd Load a starting amount to a timer which tyou are installing, which should already show an accumulated amount. For example, days since last accident.
n.OPt No Option fitted
NEg.n Negative timing not enabled. A down counter will stop at 0.
NEg.y Negative timing is enabled. A down counter will continue past 0 to show negative numbers.
NEtt Nett value, show by default.
NN.SS Timer mode: counts in minutes and seconds MM:SS.
NonE Contact closure mode is None
nr.__ Month. Used when setting the calendar.
Now it is month 09
Nr.__ Number of lineariser steps you would like to reserve.
nr._1 Number of load cells connected in parallel = 1
nr._2 Number of load cells connected in parallel = 2
nr._3 Number of load cells connected in parallel = 3
nr._4 Number of load cells connected in parallel = 4
nr._5 Number of load cells connected in parallel = 5
nr._6 Number of load cells connected in parallel = 6
nr._7 Number of load cells connected in parallel = 7
nr._8 Number of load cells connected in parallel = 8
nr._9 Number of load cells connected in parallel = 9
nr.10 Number of load cells connected in parallel = 10
NuLt Multiplication This is the Scale factor choice. For example, if the scale factor is 3 and you chose MULt, all readings will be multiplied by 3
-OC- Open circuit It appears that your sensor connection has an open circuit fault.
OC._0 Open Circuit sensor will cause the measured value to be at 0.
OC._H Open Circuit sensor will cause the measured value to be at the HIGH end of the scale.
OC._L Open Circuit sensor will cause the measured value to be at the LOW end of the scale.
Of.St Offset A fixed numeric offset, which can be negative or positive, which can be applied to your meter's readings at any time. It is useful in such applications as weighing, if structures have been added to or removed from a weighing platform. You can compensate fr these changes directly with the offset feature.
OFF Alarm channel disabled.
Off Contact closure mode is Off
Off No daylight saving compensation. Used for clocks always showing GMT, Zulu, or in regions where daylight saving is not used.
OFF.t Off-trip delay. Seconds before an alarm will reset, if the measurment is out of alarm state for the whole period.
On.tr On-trip delay. Seconds before an alarm will activate, if the measurment is in alarm state for the whole period.
-Or- Display Over Range. The positive number being sent to the display has more digits than the display.
Out.b Out Band alarm. Will cause the alarm relay to trip if the measurement falls outside upper and lower band limits.
Out.H Output High. Lets you define the highest value of an output signal range
Out.L Output Low. Lets you define the lowest value of an output signal range.
P.Frq Power Frequency - an optional installed feature to show precision frequency of the meter's AC power.
P.in Pulses In. Used for counter/totaliser scaling.
PC.Hi Pump Control - High Used to control a pump which is filling a container or reservoir.
PC.Lo Pump Control - Low Used to control a pump which is emptying a container or reservoir.
PEA.g Peak Gross value, show on display
PEA.n Peak Nett value, show on display
Pot Potentiometer Input. 3 wire or 4 wire.
Pr.C1 Protocol C1 Simple ASCII Continuous stream
Pr.H1 Protocol H1 LEL GPS receiver protocol
Pr.P1 Protocol P1 Simple ASCII addressed protocol
Pr.P2 Protocol P2 Modbus ASCII addressed protocol
Pr.P3 Protocol P3 Modbus RTU addressed protocol
Prnt Contact closure- cause a print stream to be sent from serial port.
PrSt Pre-set a count amount
Pt.01 Lineariser confirmation of which point your about to define, with In.01 and rd.01
Pt.31 Lineariser confirmation of which point your about to define, with In.31 and rd.31
Pul.H Pulsed High alarm. Gives one pulse of alarm relay, for a defined duration, when measurement exceeds setpoint.
Pul.L Pulsed Low alarm. Gives one pulse of alarm relay, for a defined duration, when measurement falls below setpoint.
quit Quit your settings without saving
r.toP The maximum resistance you want to measure, in resistance mode.
rAtE Rate
rd.__ Lineariser Reading level identifier. From rd.01 to rd.32
rdHi Reading High. Lets you define the highest value of a display range.
rdLo Reading Low. Lets you define the lowest value of a display range.
rES Resistance input, 2, 3 or 4 wire.
rEv.0 Reverse / Mirrored display for heads-up application is Off.
rEv.1 Reverse / Mirrored display for heads-up application is On.
rL.dE Relay will de-energise on alarm (failsafe)
rL.En Relay will energise on alarm (not failsafe)
rPt Repetition rate You can set how often a stream of data is sent out, when in mode C1
rSt_ Contact closure mode is Reset counts and any latched or peak / valley stored values.
rSt.n Reset - No?
rSt.Y Reset - Yes?
rtd.A RTD type A Accepts PT100 input, 2, 3 or 4 wire
rtd.B RTD type B Accepts PT100 input, 2, 3 or 4 wire
SAUE Save your settings
-SC- Short circuit It appears that your sensor connection has a short circuit fault.
Sc.__ Start Character You can set a HEX start character for a data stream. For example 02=STX
SCAL Scale A multiplying or dividing scale factor which can be applied to the meter's final reading, after normal scaling has been done. Allows easy conversaion of reading from kg to pounds, litres to gallons or pints, etc.
SEnS Sensitivity of your load cell, expressed as mV/V
SEr Serial data input function
SEt.H Upper setpoint. Used in Band-mode or Pump-Control alarms.
SEt.L Lower setpoint. Used in Band-mode or Pump-Control alarms.
SEt.P Set point The point at which an alarm relay output will change state.
SHnt Shunt input Accepts 0-50mV, 0-60mV, 0-75mV or 0-100mV DC current shunt signal.
SSS.t Timer mode: counts in seconds to 1/10 second resolution.
SSSS Timer mode: counts in whole seconds.
StoP Stop
Strt Start
t.___ Bin time Sets the duration the counting bins are open for.
t.cAP Total capacity of your weighing system
t.out Timeout of alarm relay
t.rSt Contact closure - Timer Reset
t.Stp Contact closure - Timer Stop
t.Stt Contact closure - Timer Start
tArE Tare value, show on display
tc_b Thermocouple, Type B
tc_E Thermocouple, Type E
tc_J Thermocouple, Type J
tc_K Thermocouple, Type K
tc_n Thermocouple, Type N
tc_r Thermocouple, Type R
tc_s Thermocouple, Type S
tc_t Thermocouple, Type T
thEo Theoretical calibration. You must enter expected signal levels and desired display values.
tot Totaliser function
tYPE Input Signal Type Use up or down button to choose an input signal type.
UnAv Feature is unavailable
UP Counter mode = Up (total increases)
-Ur- Display Under Range. The negative number being sent to the display has more digits than the display.
US United States daylight saving calendar.
VAL.g Valley Gross value, show on display
VAL.n Valley Nett value, show on display
Yr.__ Year. Used when setting the calendar.
Now it is year 2024


Input board test points for diagnostic checks.

Test points on analogue input board


We are here to help you!

We can help you!

Your question or comment


Your name


Your email address


Our privacy statement
Form Index: 50


Privacy Policy

print


This Privacy Notice tells you what to expect in relation to your personal information that we will collect from you and how we handle and process that information.

We carefully protect your personal data and ensure that we follow the guidelines given within the GDPR legislation.

The information that we may collect and hold is as follows:

For general enquiries:
  • Your Name
  • Your Email Address
  • Your Company name
  • Your Contact telephone numbers
  • Your Postal Address
  • A log of our communications with you
  • Your IP address

When you make an online enquiry, you can request news mailings or decline them.

When we conduct financial trade, we also collect:-
  • Trade References, where requested in order to open a trading credit account.
  • Financial Information such your Credit Rating, Banking Details and Trading history with us.
  • Delivery and invoice addresses

We use this information in part or in whole so we can efficiently conduct business with you and to maintain such records for such periods as are legally required by HMRC and other legal entities.

We store your data on our databases which are access controlled for authorised personnel only. Online data transactions use TLS links (https). We store mail and online enquiries on 3rd party databases, via TLS.

Your Rights
You have a right at any time to ask for a copy of the information about you that we hold. We will provide this free of charge to you, as soon as possible. To request information please email accounts@london-electronics.com with the subject line of GDPR Information Request.

Your Rights under GDPR are not affected by conducting business with us.

Retention of your data
Your data is held for no longer than is necessary, according to our legal obligations.

Sharing of your contact data
If we receive an enquiry from you and if you are located in a region supported by one of our Distributors or Agents, we will pass your enquiry to them, to handle on our behalf.

By necessity, your delivery details will be shared with couriers / postal organisations in order for them to fulfil their service in transporting goods to you.

We do not sell, give or exchange your data with organisations not involved in the direct processing of enquiries or orders between you and ourselves.

Who is your Data Protection Officer?
We are a small industrial services company, we do not process large amounts of sensitive personal details, so we are not required to appoint a DPO.

However, we take your data protection seriously and the Company's Board of Directors is responsible for ensuring that we maintain our obligations under GDPR.

Regards,


Graham's signature
Graham Laming - TMIET FCIM
Technical Marketing Manager

Revision 2, 19th August 2022


We are here to help you!

We can help you!

Your question or comment


Your name


Your email address


Our privacy statement
Form Index: 51


Revisions History

print

History of changes to the documentation, firmware, software and hardware.

Manuals / Handbooks
DocumentValid fromValid toChanges
Current Version 124 June 2021CurrentFirst Release
Manual Version 05 April 202124 June 2021First Prototype


Main Firmware
FirmwareValid fromValid toChanges
Firmware F0.03 B.01425 June 2021CurrentFirst Release


Hardware
Main Circuit Board
HardwareValid fromValid toChanges
9129-0270 P55 April 2021CurrentFirst Release


Display Circuit Board
HardwareValid fromValid toChanges
9129-0170 P35 April 2021CurrentFirst Release


Analogue Input Circuit Board
HardwareValid fromValid toChanges
9129-0470 P45 April 2021CurrentFirst Release


Real Time Clock Circuit Board
HardwareValid fromValid toChanges
9129-0870 P35 April 2021CurrentFirst Release


Upper Option Carrier Circuit Board
HardwareValid fromValid toChanges
9129-0370 P35 April 2021CurrentFirst Release


Analogue Output Circuit Board
HardwareValid fromValid toChanges
9129-0570 P25 April 2021CurrentFirst Release


Data Output Circuit Board
HardwareValid fromValid toChanges
9129-0670 P45 April 2021CurrentFirst Release


We are here to help you!

We can help you!

Your question or comment


Your name


Your email address


Our privacy statement
Form Index: 52
Icons made by Freepik from www.flaticon.com